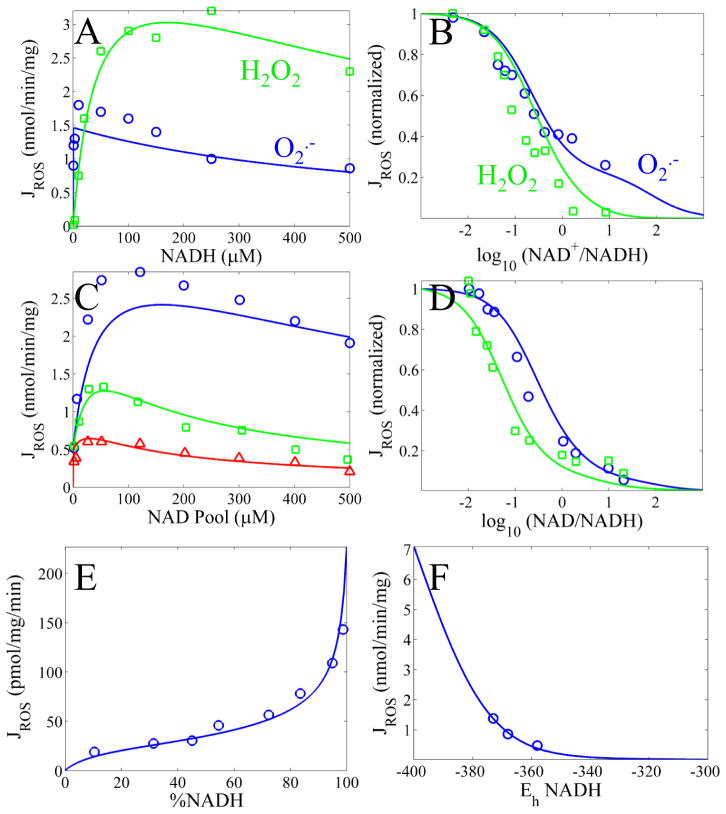
Figure 3. Model simulations of superoxide (O2·−), hydrogen peroxide (H2O2) or total ROS production.
A) Rates of simulated O2·− (blue) or H2O2 (green) production as a function of NADH concentration are compared to data from [11]. B) Normalized rates of simulated O2·− (blue) or H2O2 (green) production as a function of NAD+/NADH are compared to data from [11]. C) Rates of simulated ROS (O2·− + H2O2) production as a function of NADH concentration at a 0:1 (blue), 1:5 (green) and 1:1 (red) NAD+:NADH ratios are compared to data from [17]. D) Normalized rates of simulated O2·− ROS (O2·− + H2O2) production as a function of NAD+/NADH for a 50 (blue) and 500 (green) μM NADH pool size are compared to data from [17]. E) Rates of simulated ROS (O2·− + H2O2) production from the flavin as a function of %NADH[18]. F) Rates of simulated ROS (O2·− + H2O2) production from the SQ as a function of redox potential. Q10 redox values, ΔΨ, and matrix pH are set as reported in [9].

