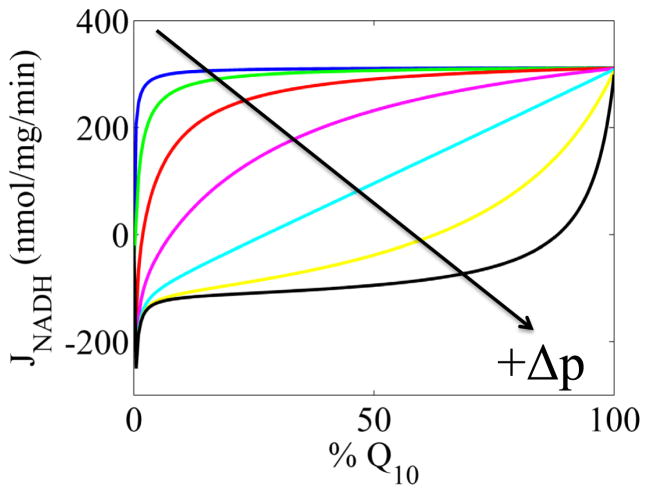
Figure 4. Model simulations of NADH oxidation rates as a function of Q pool redox state at various fixed Δp’s.
The Δp increased from 140 mV to 200 mV in 10 mV increments starting from the top, blue line. The arrow indicates the direction of Δp decrease. The Q-reductase site parameters are the Q10 ones listed in Table S2. For all curves NADH is 50% of the NAD(H) pool. Both matrix and cytosolic pH equal 7.1, so the Δp is equivalent to the ΔΨ.

