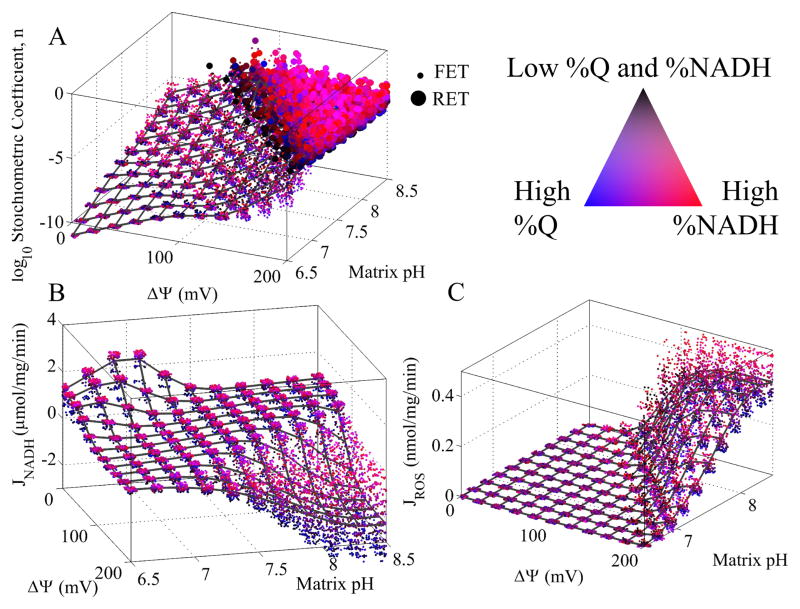
Figure 5. Model simulation of ROS stoichiometric coefficient, n, NADH oxidation, and ROS production as a function of ΔΨ, matrix pH, %NADH, and %Q.
The ΔΨ and pH are plotted on the main independent axes, and the %NADH and %Q are depicted using a color scheme. The legend for the color scheme is indicated in the figure. Blue indicates high %Q, red indicates high %NADH, magenta indicates both high %Q and %NADH, and black indicates low %Q and %NADH. In A), small points corresponding to forward electron transport (FET) and large circles represent reverse electron transport (RET) operating conditions. FET is defined as NADH-induced reduction of Q. RET is defined as QH2-induced reduction of NAD+. The mesh represents the average value at a given ΔΨ and pH value. In C, JROS is equal to JO2·−/2 + JH2O2. Cytosolic pH was set to 7.1 in all simulations.

