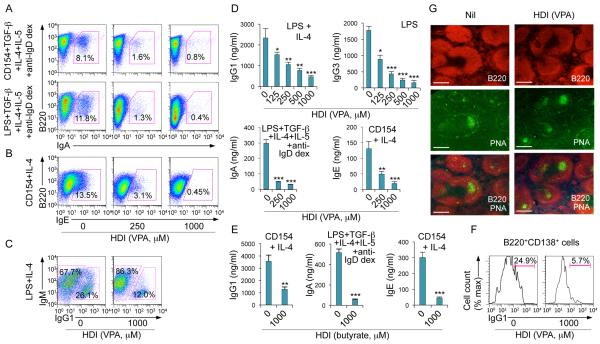
FIGURE 3.
HDI inhibit CSR, and IgG, IgA and IgE production in dose-dependent fashion, but not GC formation. (A) Surface expression of B220 and IgA in B cells stimulated with CD154 or LPS plus TGF-β, IL-4, IL-5 and anti-IgD dextran in the presence of nil or increasing doses of VPA for 4 d. (B) Intracellular expression of IgE in B cells stimulated with CD154 plus IL-4 in the presence of nil or increasing doses of VPA for 4 d. (C) Intracellular expression of IgM and IgG1 in B cells stimulated with LPS plus IL-4 for 4 d in the presence of nil or VPA. (D) IgG1, IgG3, IgA or IgE in culture fluids of B cells stimulated with LPS plus IL-4, LPS alone, LPS plus TGF-β, IL-4, IL-5 and anti-IgD dextran or CD154 plus IL-4, respectively, for 7 d in the presence of nil or increasing doses of VPA. (E) IgG1, IgA and IgE in culture fluids of B cells stimulated with CD154 plus IL-4 or LPS plus TGF-β, IL-4, IL-5 and anti-IgD dextran for 7 d in the presence of nil or butyrate. Data are from three independent experiments (mean and SEM). *p < 0.05, **p < 0.01, ***p < 0.001, unpaired t-test. (F) Proportions of IgG1+ plasmablasts (B220+CD138+), as measured by surface expression of B220, CD138 and IgG1 in B cells stimulated with LPS plus IL-4 for 7 d in the presence of nil or VPA. (G) GC structure, as visualized by fluorescent microscopy (B220, red; PNA-binding lectin, green) in the spleens of mice that were on HDI-water or untreated water and injected with NP16-CGG for 10 d (as in Figure 1). Data are representative of three independent experiments; scale bars, 50 μm.

