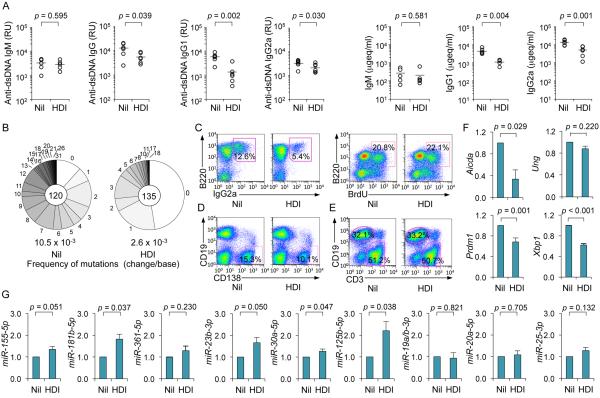
FIGURE 9.
HDI impair class-switched and hypermutated autoantibody response, increase selected miRNAs and decrease target Aicda and Prdm1 mRNAs, as well as Xbp1 mRNA in MRL/Faslpr/lpr mice. Female MRL/Faslpr/lpr mice were started on HDI-water or untreated water at the age of 6 wk, and analyzed at the age of 12 wk. (A) Titers of circulating anti-dsDNA IgM, IgG, IgG1 and IgG2a, and total IgM, IgG1 and IgG2a (n is at least 5 mice per group). p values, unpaired t-test. (B) Frequency of somatic point-mutations was reduced by 75% in MRL/Faslpr/lpr mice given HDI-water. A 700 bp intronic JH4-iEμ DNA in CD19+PNAhi Peyer’s patch GC B cells was amplified and sequenced (sequence data were pooled from three mice in each group). Pie charts depict the proportions of sequences that carried 1, 2, 3, etc. point-mutations (center of pie: number of independent sequences analyzed). Listed below the pie charts are overall mutation frequencies (changes/base). (C) Proportions of IgG2a+ B cells, and proliferation of spleen B220+ cells (analyzed by administration of BrdU in drinking water at 10 wk of age). (D) CD19loCD138+ plasma cells in spleens. Data are representative of three independent experiments. (E) Surface CD19 and CD3 expression in spleen cells. Data are from one of three independent experiments yielding comparable results. (F) Aicda and Ung transcripts (in spleen CD19+CD138− B cells, normalized to Cd79b transcript) and Prdm1 and Xbp1 transcripts (in spleen CD19loCD138+ plasma cells, normalized to Gapdh transcript) were measured by qRT-PCR. Values in mice that were on HDI-water are depicted as relative to the expression of each transcript in mice that were on untreated water, set as 1. Data are mean and SEM from four independent experiments. (G) miRNA expression in CD19+CD138− spleen B cells was measured by qRT-PCR and normalized to expression of small nuclear/nucleolar RNAs RNU6-1/2, SNORD61, SNORD68, and SNORD70. miRNA expression in the B cells from mice that were on HDI-water are depicted as relative to the expression of each miRNA in the B cells from mice that were on untreated water, set as 1. Data are mean and SEM from three independent experiments. p values, unpaired t-test.

