
Fig. 1.
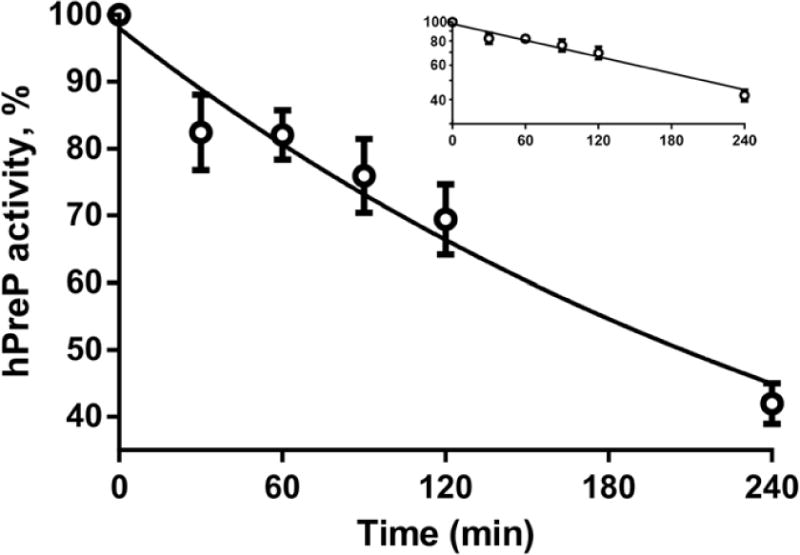
Kinetics of inactivation of hPreP by 500 μM hydrogen peroxide at pH 8.2. The plotted points are the mean and SEM for 3 experiments performed on separate days. The insert plots the same data as a semilogarithmic plot and demonstrates that inactivation is first order. The semilogarithmic plot was fit by linear regression and drawn as a solid line in both plots. Log(hPreP activity) = 1.99 – 0.00141(min), R2=0.86. The time to half-inactivation is 3.4 h.