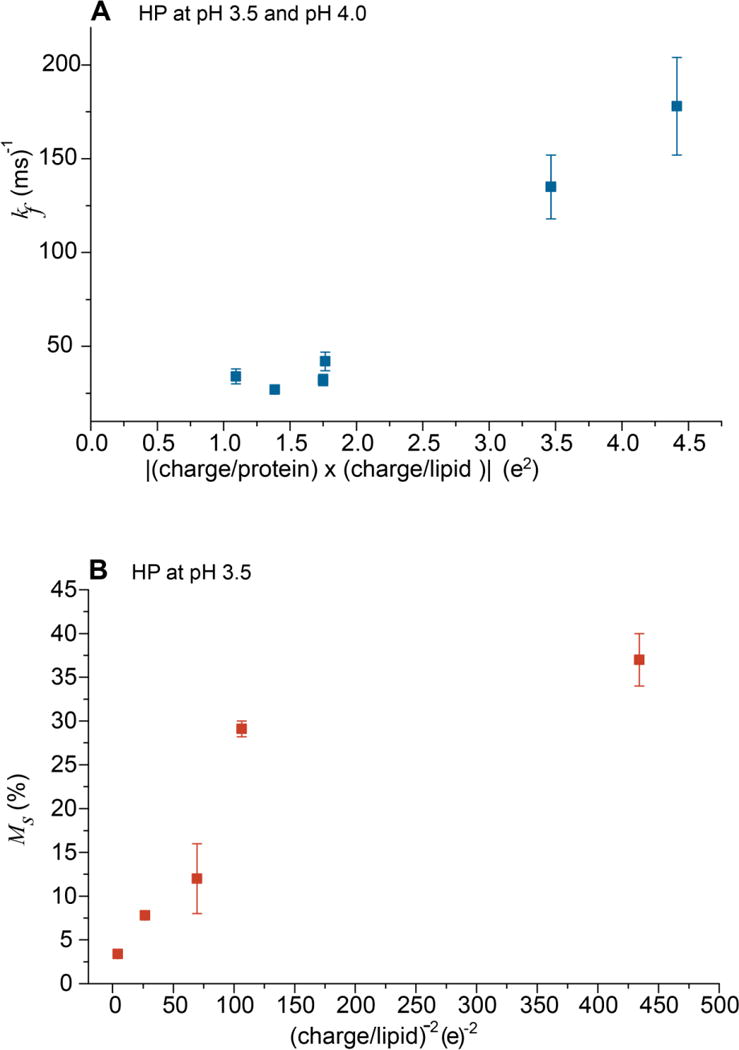
Figure 4.

Plots of (A) kf vs |(charge/protein) × (charge/lipid)| and (B) Ms vs (charge/lipid)−2. The positive correlation of plot A supports the fast process resulting from release of electrostatic energy from protein/vesicle binding. Plot B supports an inverse correlation between the extent of slow fusion and inter-vesicle repulsion. Plot A displays data for HP at pH 3.5 and 4.0 and plot B displays data for HP at pH 3.5.
