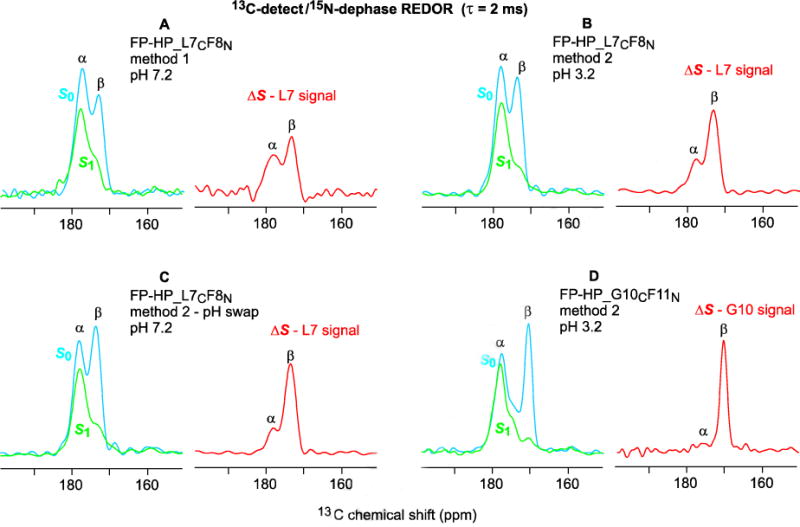
Figure 5.

13C-detect/15N-dephase REDOR SSNMR spectra of (A–C) FP-HP_L7CF8N and (D) FP-HP_G10CF11N samples with 2 ms dephasing time. Both lab and na 13CO nuclei contribute to each S0 (blue) spectrum, the signals of lab nuclei are strongly attenuated in the S1 (green) spectrum, and the ΔS = S0 – S1 (red) spectrum is dominated by the lab 13CO signal. The α and β assignments are based on comparison with database distributions of 13CO shifts and with the corresponding lab 13CO shifts of membrane-associated FP without the NHR, loop, and CHR regions. The samples contained PC:PG:Chol in 8:2:5 mole ratio and protein:lipid mole ratio ≈ 0.02.
