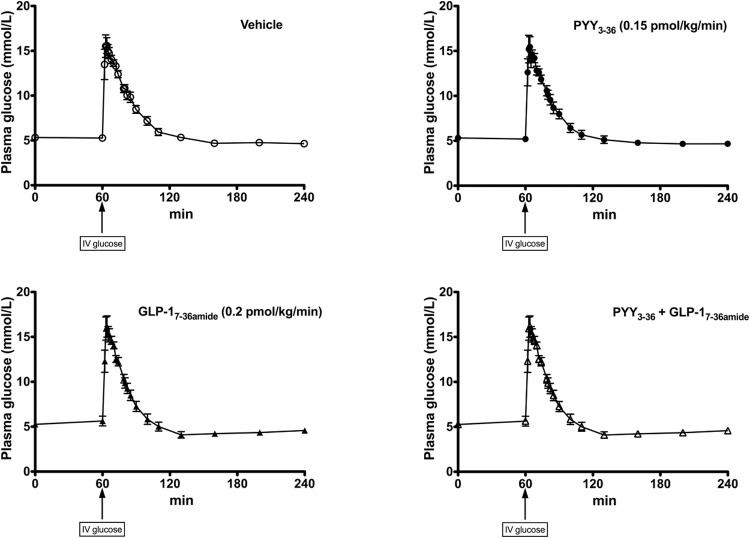
Figure 2.
Plasma glucose levels during the FSIVGTT. Y-axis shows plasma glucose levels (mmol/L). X-axis shows time (min). iv glucose bolus (0.3 g/kg) given at 60 min. Mean ± SEM plotted. Open circles, dashed line placebo infusion arm; closed circles, solid line: PYY3–36 infusion (0.15 pmol/kg/min). Closed triangles, solid line: GLP-17–36 amide infusion (0.2 pmol/kg/min). Open triangles, solid line: combined PYY3–36 + GLP-17–36 amide infusion. Fasting glucose values for vehicle, 5.3 ± 0.1 mmol/L; PYY3–36, 5.3 ± 0.2 mmol/L; GLP-17–36 amide, 5.3 ± 0.1 mmol/L; combined PYY3–36 + GLP-17–36 amide, 5.4 ± 0.1 mmol/L.

