
Figure 1.
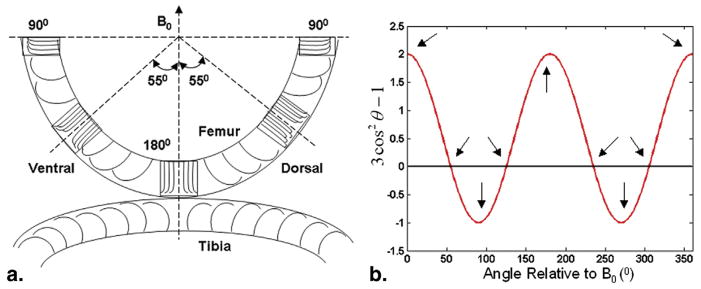
(a) The schematic diagram of the arrangement of collagen fibers across different layers of human cartilage. Three magnified details of the local regions of human femoral cartilage display the corresponding subregions oriented 90°, 55° (magic angle), and 180° with respect to the external static magnetic field B0, respectively. (b) The plot showing the (3 cos2θ−1) factor as a function of angle with respect to B0 for nuclear dipolar interaction. Two arrows identify the discrete sampling points where (3 cos2θ−1), the θ equals approximately 55° and 125°, respectively, and the magic-angle effect may emerge in these two sampling positions. Other arrows show the sampling positions where the (3 cos2θ−1) factor has the maximal and minimal values, respectively.