Figure 5.

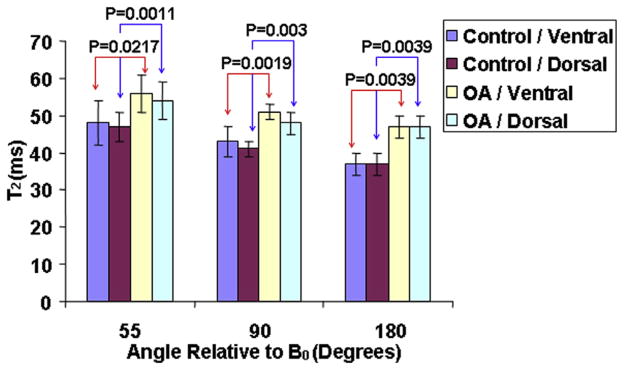
The combined bar charts of the average ventral and dorsal T2 values in subregions oriented 55°, 90°, and 180° relative to B0 for healthy and osteoarthritis (OA) subjects, respectively.

The combined bar charts of the average ventral and dorsal T2 values in subregions oriented 55°, 90°, and 180° relative to B0 for healthy and osteoarthritis (OA) subjects, respectively.