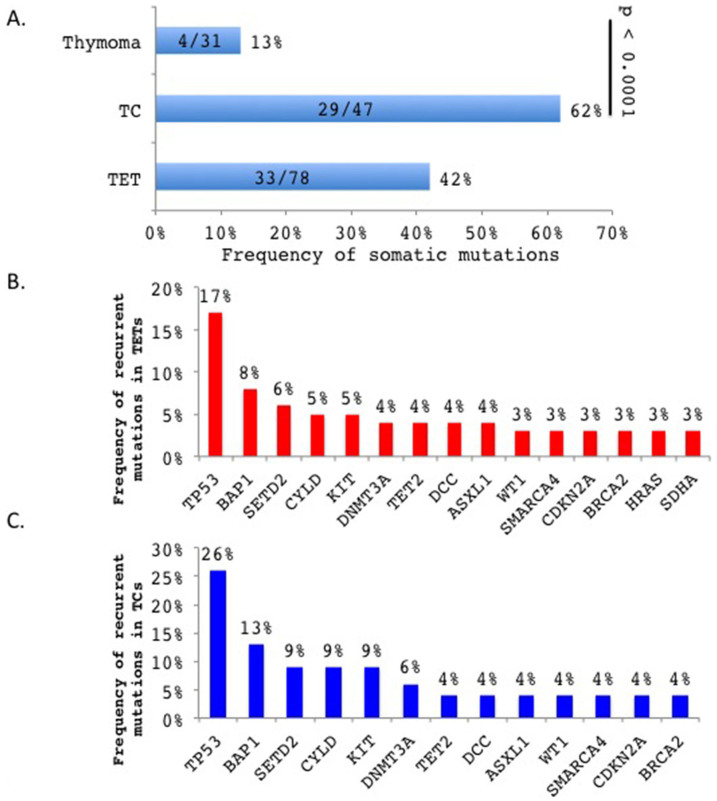
Figure 1.
(A). TCs exhibited higher incidence of somatic mutations than thymomas (p < 0.0001, Chi-square test). The numbers in the bars indicate the number of cases with somatic mutations out of total number of cases analyzed. (B). Frequency of recurrent mutations in TETs. (C). Frequency of recurrent mutations in TCs.

