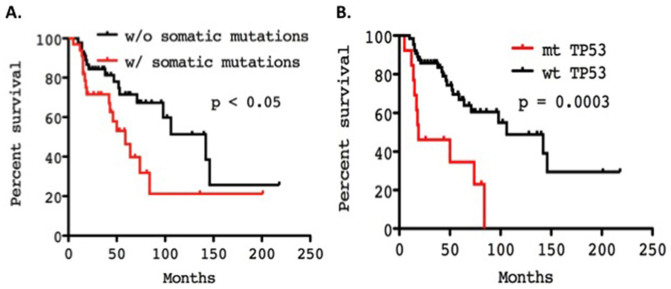
Figure 4.
(A). Overall survival of TET patients with and without somatic mutations. (B). Overall survival of TET patients with and without TP53 mutations. Survival curves were generated with Kaplan-Meier method and the differences evaluated by the Log-rank (Mantel-Cox) test. mt, mutant; wt, wild-type.

