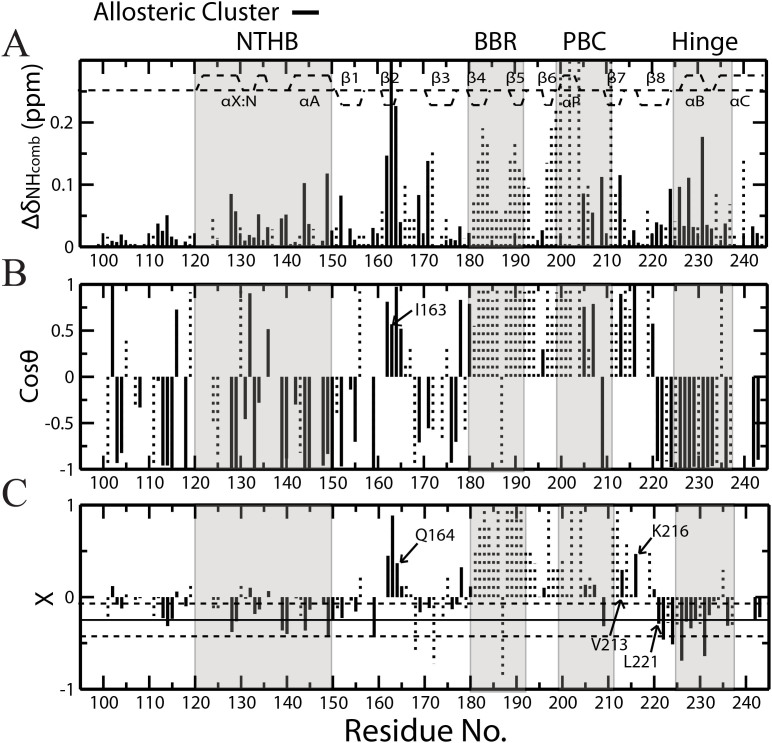
Figure 2. The chemical shift projection analysis (CHESPA) of Rp-cAMPS (Rp) bound PKA RIα CBD-A.
(A) The ΔδNHcomb vs. residue plot for Rp-cAMPS bound vs. apo PKA RIα (91-244). Solid black lines represent residues belonging to the allosteric cluster identified from the CHESCA-SL analysis, while the ΔδNHcomb values of other residues are reported as dotted vertical bars. The secondary structure of PKA is shown as dashed lines at the top of the plot. (B) The cosθ vs. residue plot. The θ angle is defined in Figure S2. (C) Plot of fractional activations (X) vs. residue. Fractional activations are defined in Figure S2. The solid horizontal line represents the average of all the negative X values with adjacent horizontal dashed lines corresponding to the average +/- one standard deviation. Selected residues are highlighted.

