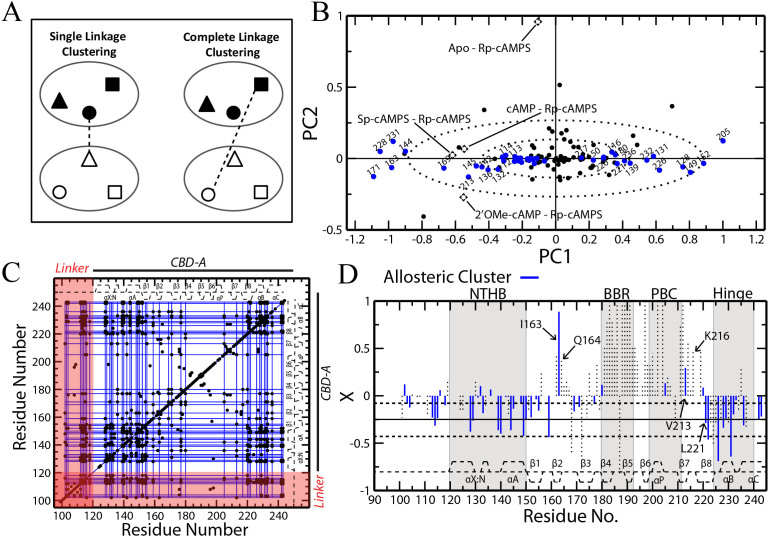
Figure 4. Complete-linkage agglomerative clustering maps allosteric networks without “chaining effects”.
(A) Schematic comparison of single vs. complete linkage clustering. The shapes (triangle, circle and square) represent residues within existing clusters (large ovals) and the dashed line depicts the method by which the two clusters are linked. (B) Singular value decomposition (SVD) analysis of the combined chemical shifts of PKA RIα (91-244). Loadings are shown as black dashed diamonds and scores are shown as circles. Blue scores represent residues from the reconstructed allosteric cluster determined by complete-linkage clustering (Figures S3 and S4). The dashed ovals correspond to the standard deviations of PC1 and PC2. (C) The correlation matrix for PKA RIα (91-244) with complete-linkage clusters shown as blue lines. Only correlations with |rij| ≥ 0.98 are shown (black dots). The secondary structure is displayed as dashed lines along the top and side of the plot. (D) A plot of Rp-bound fractional activations similar to Figure 2C, but with residues from the complete-linkage cluster shown as blue lines. Selected residues are labelled, including I164 and V213 that exhibit positive X values unlike the majority of the residues in the allosteric cluster identified through complete linkage.

