Figure 1.
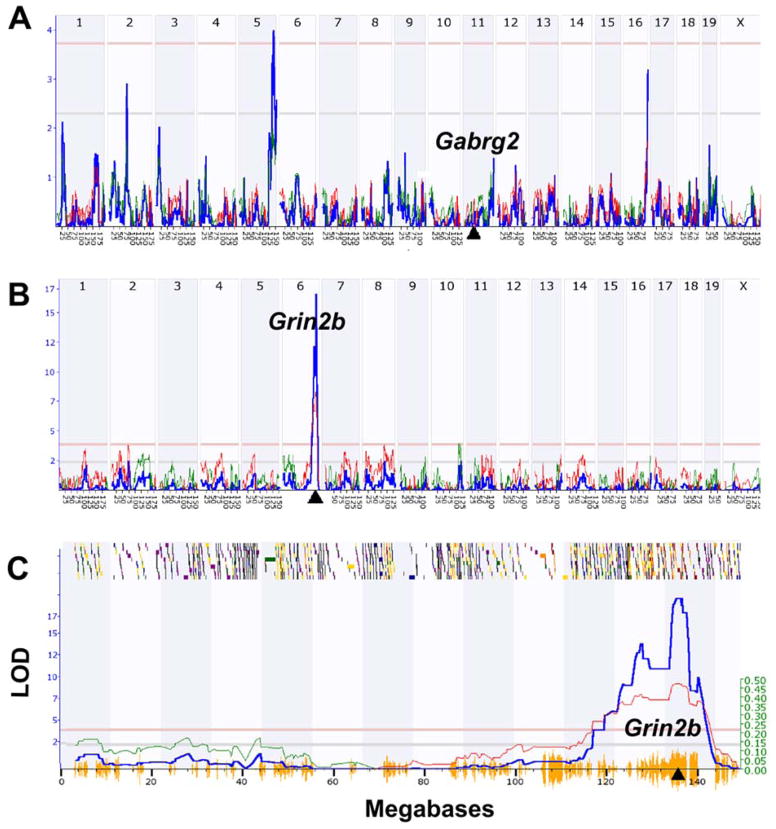
Linkage maps of cis and trans eQTLs in mouse hippocampus. (A) Gabrg2 expression is controlled by a trans eQTL on Chr 5 at 138 Mb (LRS = 18.2 on the Y axis, equivalent to a LOD score of 3.94). The Gabrg2 gene itself is located on Chr 11 at 41 Mb (triangle on X axis). (B) In contrast, Grin2b expression is controlled by a cis eQTL with a peak LRS score of 77 located on Chr 6 at 135 Mb. This location corresponds precisely to the location of the Grin2b gene (triangle). (C) Magnified view of the Grin2b cis eQTL that provides much more detail on the QTL map and its chromosomal context. The small shaded or colored blocks along the top represent genes on mouse Chr 6. Shading is used to encode the density of polymorphic SNPs within each gene. The horizontal lines provide genome-wide significance thresholds for the QTL determined by permutation analysis (upper <.05 and lower <.63). The hash on the X axis summarizes the density of SNPs along the chromosome. Regions of the genome that are identical by descent (i.e., not variable in the BXD family) have almost no X axis hash. Finally, the so-called additive genetic effect (see Ref 12) is marked by the thinner line and the right-side Y axis. All data here were generated in GeneNetwork (www.genentwork.org) using the BXD mouse Hippocampus Consortium M430v2 (Jun06) PDNN array data set (GeneNetwork.org, accession number GN112, n = 67, probe sets 1418177_at and 1457003_at).

