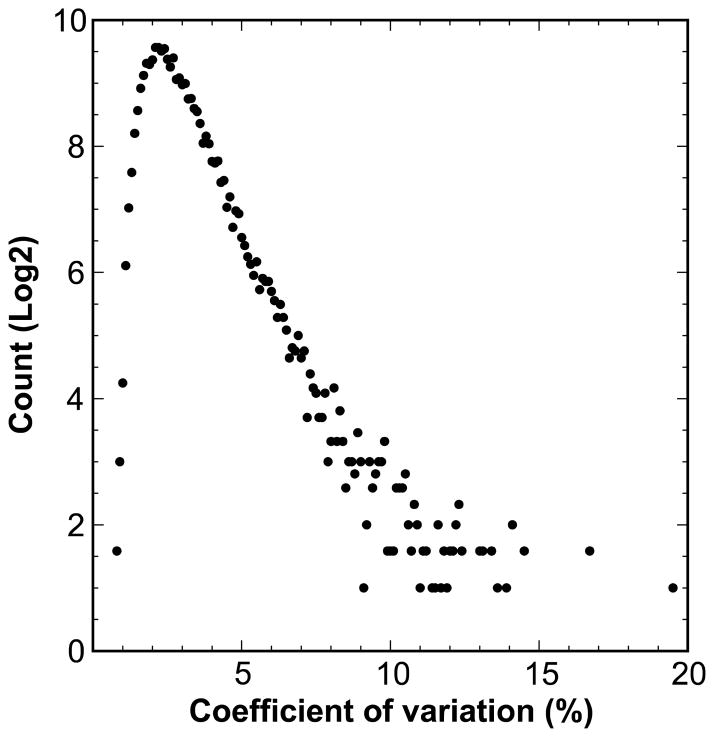
Figure 2.
Expression variation in hippocampal mRNA expression. Log transformed gene expression values were used to calculate the coefficient of variation (X axis) across 99 genetically diverse strains. The Y axis represents log2 of numbers of assays. A total of ~44,500 probe sets in the Hippocampus Consortium data (GN112) were used to generate this plot.

