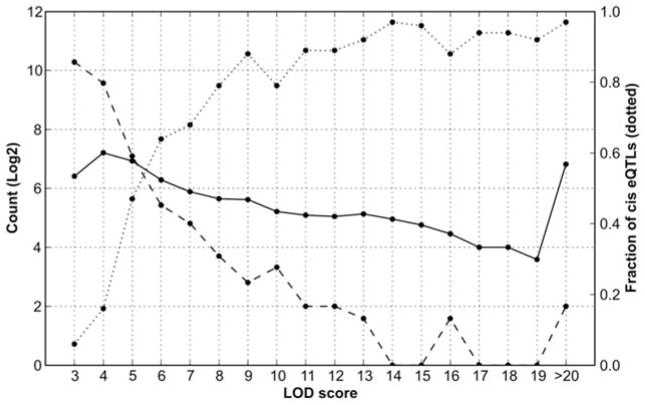
Figure 3.
Comparison of LOD scores of cis and trans eQTLs. Numbers of cis eQTLs (solid) and trans eQTLs (dashed) are plotted on left y-axis as a function of LOD score (X axis). The fraction of cis eQTLs (dotted) are plotted on right Y axis. Cis eQTLs are defined as those eQTLs within 5 Mb of the parent gene. Trans eQTL are usually on different chromosome or more than 10 Mb from the parent gene. A total of 44,500 probe sets in the Hippocampus Consortium data were analyzed.

