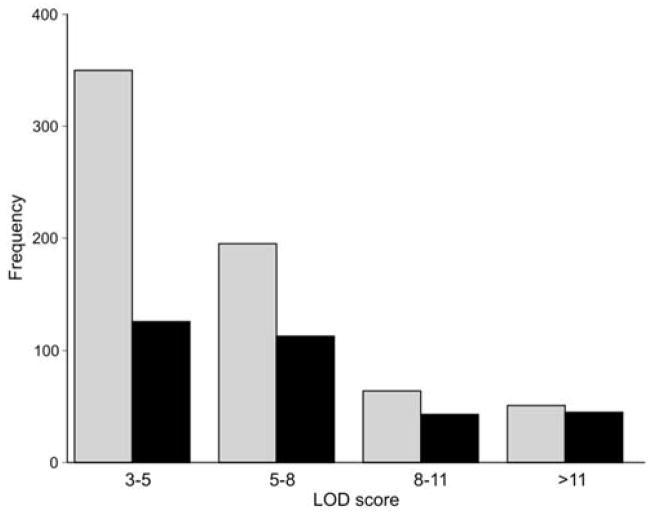
Figure 4.
Impact of cellular heterogeneity on detection of cis eQTLs. Numbers of cis eQTLs identified in the cerebellum (grey bars) are plotted as a function of LOD score. A subset of these cerebellar cis eQTLs were also identified in matched whole brain data (black bars). A total of ~44,500 probe sets in the GE-NIAAA cerebellum (GN72, n = 28) and whole brain (GN123, n = 30) set were used for this analysis.

