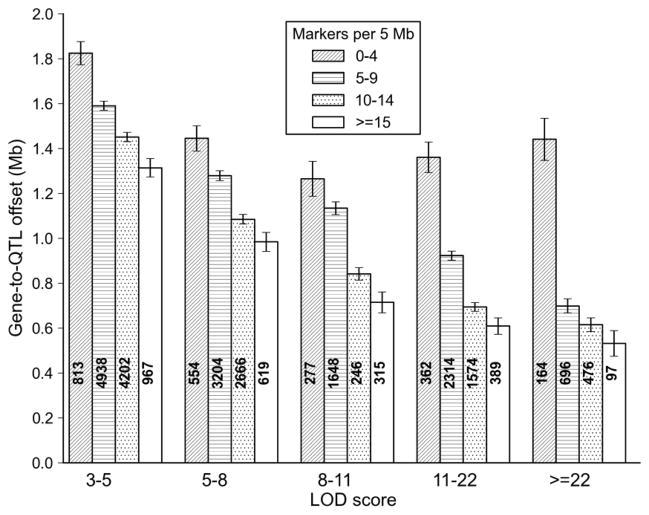
Figure 6.
QTL mapping precision of the BXD family. The precision of QTL mapping was estimated empirically by measuring the distance between the marker closest to the cis QTL peak and the location of the parent gene (specifically, the position of the proximal-most nucleotide in each probe set associated with a cis eQTL). A total of ~27,500 cis eQTLs were used for this analysis (GN206, n = 67 BXD strains). Average precision in megabases (Y axis) is plotted as a function of LOD score (X axis). Each bar includes a count of cis eQTLs and the SEM. Four levels of shadings were used to evaluate the effects of marker density (per 5 Mb bin) on precision. Precision varies from ± 1.2–1.8 Mb for cis eQTLs with modest LOD scores to ±0.5 Mb for cis eQTL with high LOD scores in regions with high marker density. Precision would be improved by a factor of two by including all strains

