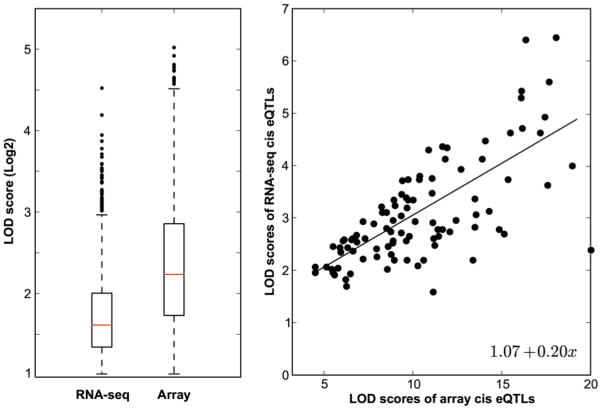
Figure 7.
Comparison of cis eQTLs identified by arrays and RNA-seq. (A) The box plots show LOD score distributions (Y axis) for RNA-seq (n = 1,779) versus arrays (n = 2,839). Cis eQTLs are defined as those eQTLs having a LOD score of greater than 2.0 and within 5 Mb of the parent gene. A total of ~44,500 assays in a whole brain array data set (GN123, n = 30) were compared to ~200,000 exons in a whole brain RNA-seq data set (GN394, n = 28). (B) Scatter plot of LOD scores for 105 cis eQTLs shared by array and RNA-seq data sets.

