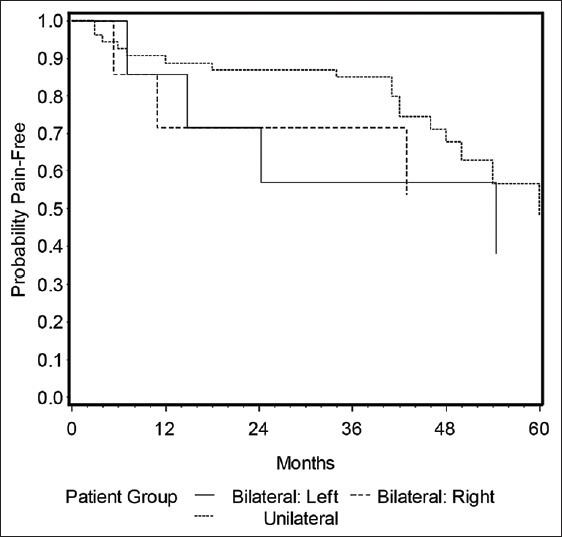
Figure 1.

Kaplan–Meier plot of bilateral TN patient outcomes by side and unilateral TN patient outcomes as time-to-failure in months

Kaplan–Meier plot of bilateral TN patient outcomes by side and unilateral TN patient outcomes as time-to-failure in months