Figure 1.

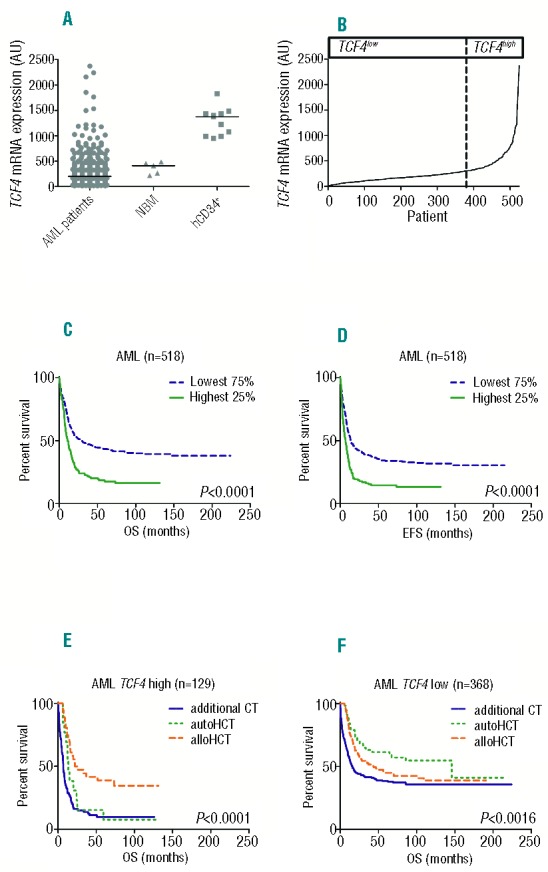
TCF4 expression and survival curves in the first cohort. (A) Expression of TCF4 in AML patients (n=525), NBM (n=5) and hCD34+ (n=11). (B) TCF4 expression ranked from lowest to highest expression (n=525). (C) Overall survival (OS) curves for AML patients with available follow-up data (n=518) stratified by TCF4high (n=129) and TCF4low (n=389). (D) Same for event-free survival (EFS). (E) OS curves for 7CF4high AML patients with available follow up and consolidation treatment data (n=129) stratified for conditioning with alloHCT (n=36), autoHCT (n=13) or additional CT (n=80). (F) OS curves for TCF4low AML patients with available follow up and consolidation treatment data (n=386) stratified for conditioning with alloHCT (n=99), autoHCT (n=57) or additional CT (n=212).
