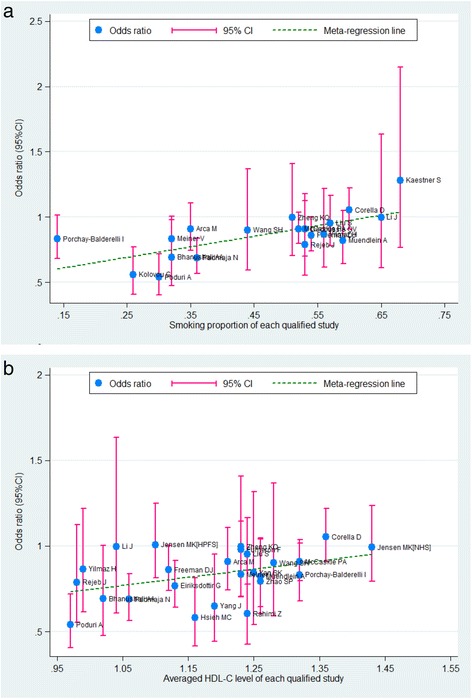
Figure 4.

Meta-regression of overall smoking proportion (a) and averag HDL-C level (b) on in-allele risk estimates of the TaqIB polymorphism. OR is expressed as the middle of the blue solid circle whose upper and lower extremes represent the corresponding 95% CI. The green dotted line is plotted by fitting OR with overall smoking proportion (a) and averaged HDL-C level (b) for each included study.
