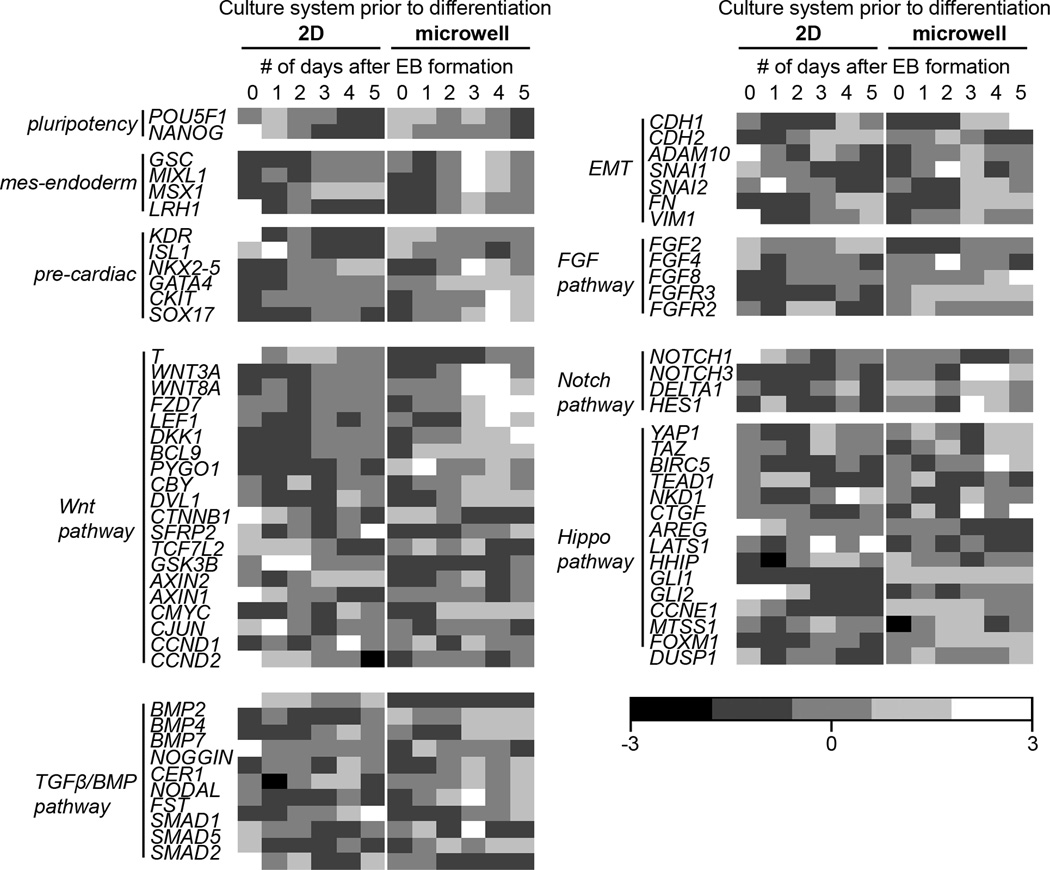
Figure 4.
Gene expression heat maps in EBs from 2D TCPS-cultured hESCs and 3D microwell-cultured hESCs. RT-PCR quantification of gene expression, relative to GAPDH and ACTB, in EBs 0–5 days after formation from hESCs cultured on 2D TCPS or in 3D microwells. RT-PCR analysis of pluripotent, mesendoderm, pre-cardiac, FGF pathway, Wnt pathway, Notch pathway, Hippo pathway and TGFβ/BMP pathway was performed. Values along each row (representing a single gene) were normalized so that the mean equals 0 and the standard deviation equals 1. Lighter shades of gray indicate higher (>0) expression and darker shades of gray indicate lower (<0) expression.

