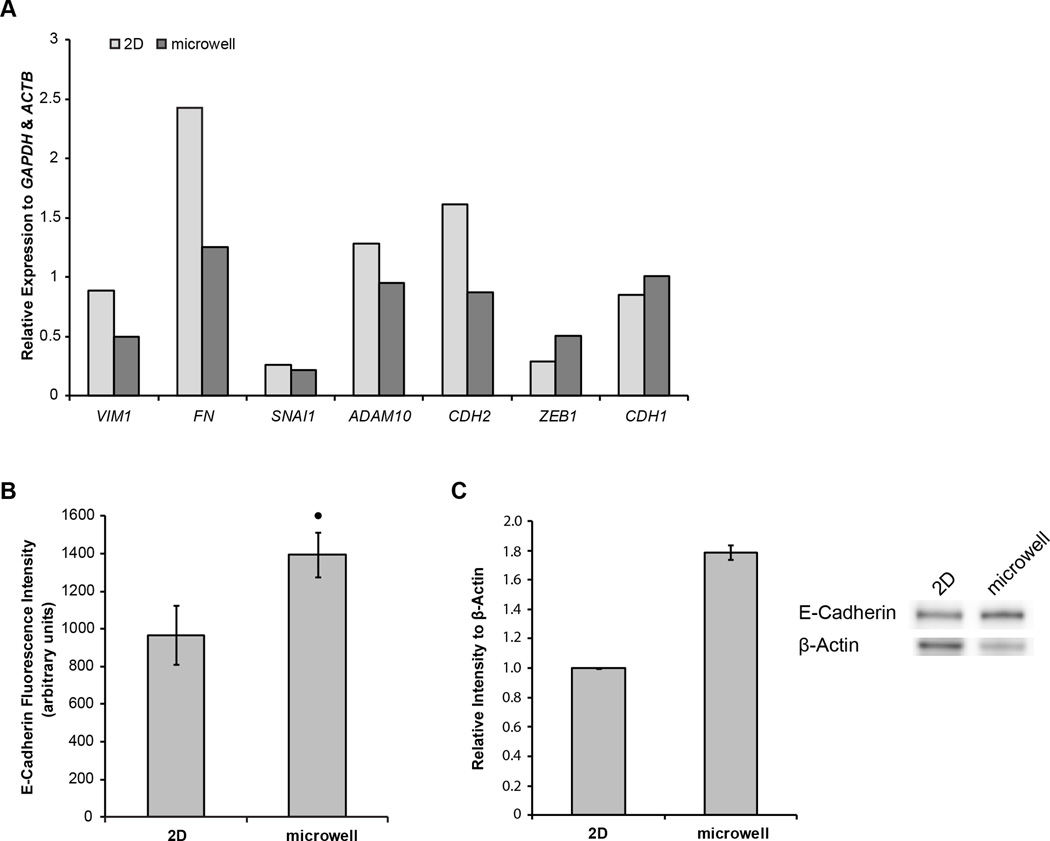
Figure 5.
(A) Quantification of representative EMT-related gene expression agarose gel bands, relative to GAPDH and ACTB, in undifferentiated hESCs cultured for 6 days on 2D TCPS (light) and in 3D microwells (dark) (B) Average intensity of E-cadherin fluorescence per cell, determined by flow cytometry, in undifferentiated hESCs cultured on 2D TCPS and in 3D microwells. (C) Quantification of western blot intensities of E-cadherin relative to β-actin in biological replicates of hESCs cultured for 6 days on 2D TCPS or in 3D microwells. Sample western blots representative of data are shown (• indicates p<0.05 compared to same-day 2D control)

