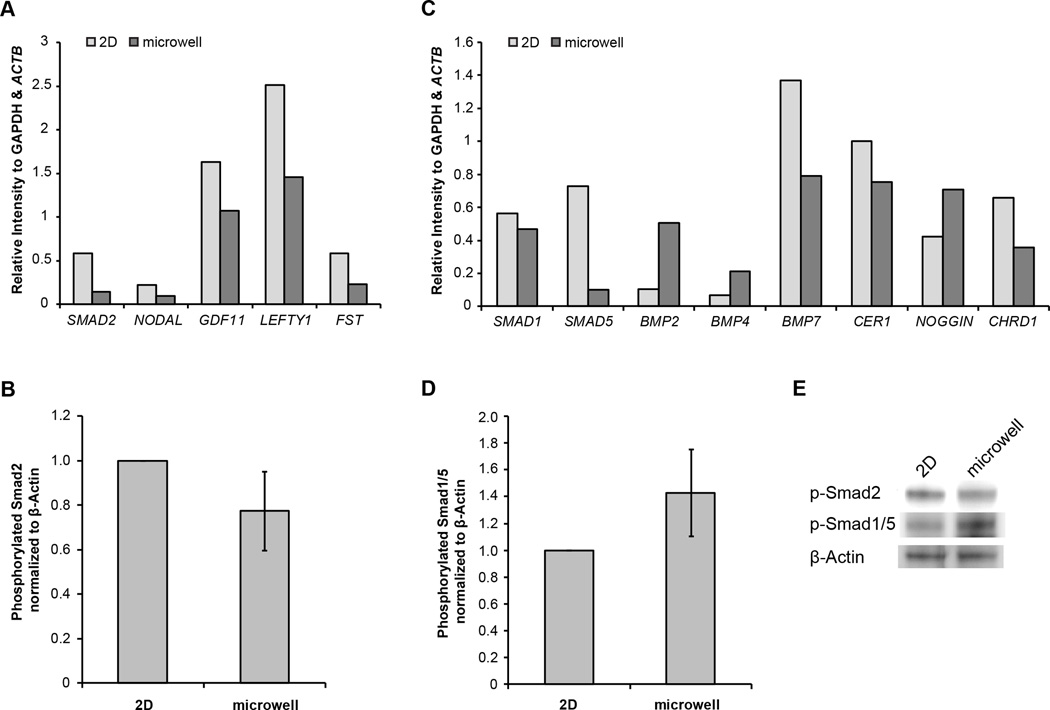
Figure 6.
(A) Quantification of representative TGFβ/Activin/Nodal pathway gene expression agarose gel bands, normalized to GAPDH and ACTB expression in undifferentiated hESCs cultured for 6 days on 2D TCPS (light) or in 3D microwells (dark) (B) Quantification of western blot intensities of phosphorylated Smad2 normalized to β-actin in biological triplicates of protein extracts obtained from undifferentiated hESCs cultured for 6 days on 2D TCPS or in 3D microwells. Quantification of intensities was normalized to 2D samples. (C) Quantification of representative BMP pathway gene expression agarose gel bands, relative to GAPDH and ACTB, in undifferentiated hESCs cultured for 6 days on 2D TCPS (light) and in 3D microwells (dark) (D) Quantification of western blot intensities of phosphorylated Smad1/5 normalized to β-actin in biological triplicates of protein extracts obtained from undifferentiated hESCs cultured for 6 days on 2D TCPS or in 3D microwells. Quantification of intensities was normalized to 2D samples. (E) Sample western blots representative of data in panels (B) and (D).

