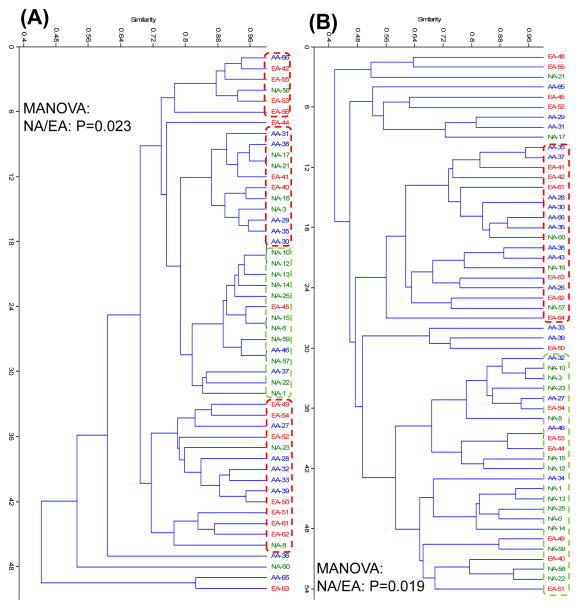
Figure 4. Diversity of dsrA and Desulfovibrio 16S rRNA gene sequences.
A nested PCR-TRFLP approach was used for the amplification of dsrA and Desulfovibrio spp. 16S rRNA genes from stool samples. Sample preparation and data analyses were executed as described in Fig. 1. Differences in the structure and composition of dsrA and Desulfovibrio spp. 16S rRNA gene sequences between the three groups were examined by multivariate analysis. (A) Cluster analysis of dsrA TRF derived from the Kulczynski similarity index (presence-absence data) and B) Cluster analysis of Desulfovibrio spp. 16S TRF derived from the Kulczynski similarity index. Green symbols represent NA; blue symbols, AA and red symbols, EA. Each symbol designates a single subject. Intergroup differences among NA, AA and EA were estimated by means of non-parametric MANOVA. Differences were considered significant if P < 0.05.

