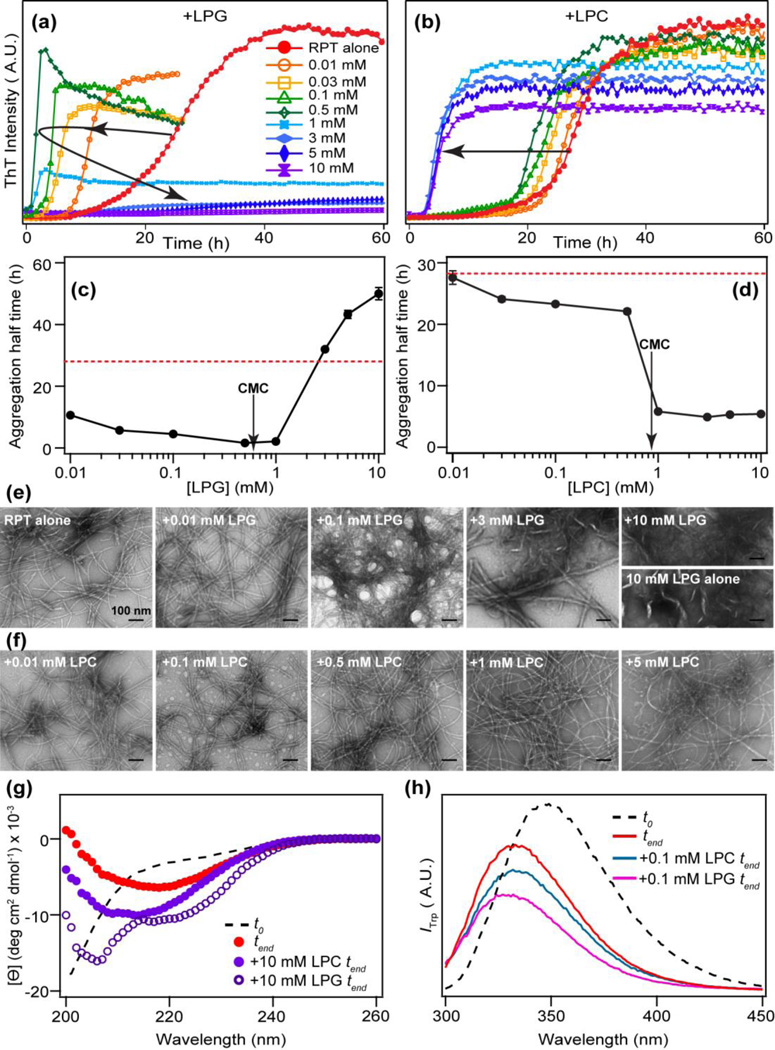
Fig. 3.
Effects of lysolipids on RPT aggregation kinetics and fibril morphology. RPT aggregation kinetics were monitored by ThT in the presence of different concentrations of LPG (a) and LPC (b). Each reported kinetic curve is an average of at least 3 wells from one plate. Lysolipid concentrations are as indicated. Aggregation half time (t1/2) vs. lipid concentration is shown in (c) for LPG and (d) for LPC, respectively. For reference, t1/2 for RPT alone in buffer is also shown as a red dashed line. Critical micelle concentrations (CMC) are indicated with arrows. Errors bars are standard deviations (n ≥ 2). Representative TEM images are shown for RPT aggregated in the presence of LPG (e) and LPC (f). Lipid concentration of each sample is shown. The image of 10 mM LPG alone is shown for comparison. Scale bar is 100 nm. (g) CD spectra of RPT in the presence of 10 mM LPC and LPG compared to RPT alone at the end of aggregation experiments (tend). (h) W423 fluorescence in the presence of 0.1 mM LPG and LPC at the end of aggregation experiments (tend). Black dashed line in (g) and (h) is RPT in solution before aggregation (t0).

