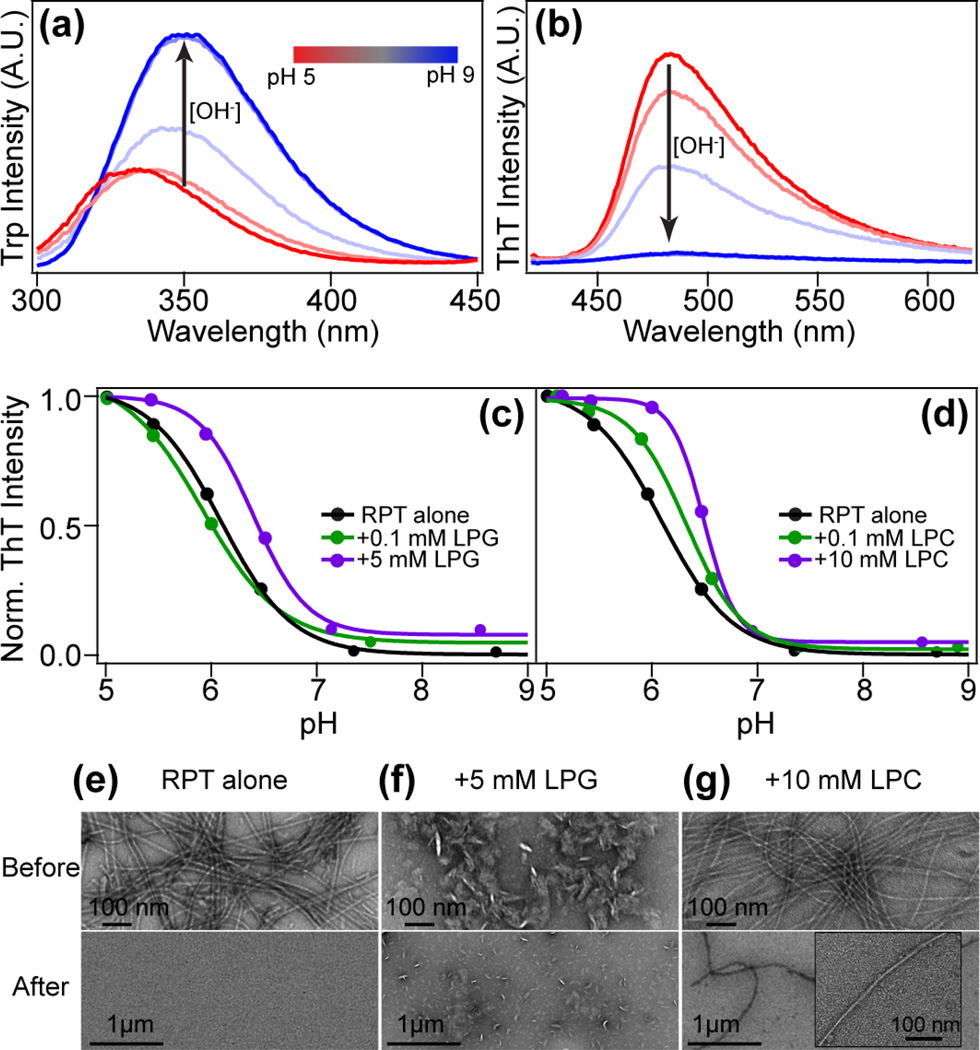
Fig. 4.
Dissolution of RPT fibrils formed in the presence of lysolipids. (a) W423 spectral changes of RPT filaments formed at pH 5 in the presence of 0.1 mM LPG as the solution pH is increased (pH 5–9). (b) Corresponding ThT spectral changes of RPT filaments formed at pH 5 in the presence of 0.1 mM LPG as the solution pH is increased (pH 5–9). Values of pH are presented as a color bar from red to blue. Fibril dissolving profile with LPG (c) and LPC (d) is plotted as normalized ThT intensity vs. solution pH. Dissolution of RPT fibrils formed in the absence of lysolipids (RPT alone) is also shown for comparison. (e)–(g) Corresponding TEM images of before (top) and after (bottom) dissolution experiments. A zoomed-in fibril image is shown as an inset (panel g bottom). Scale bars are as shown.

