Fig. 5.
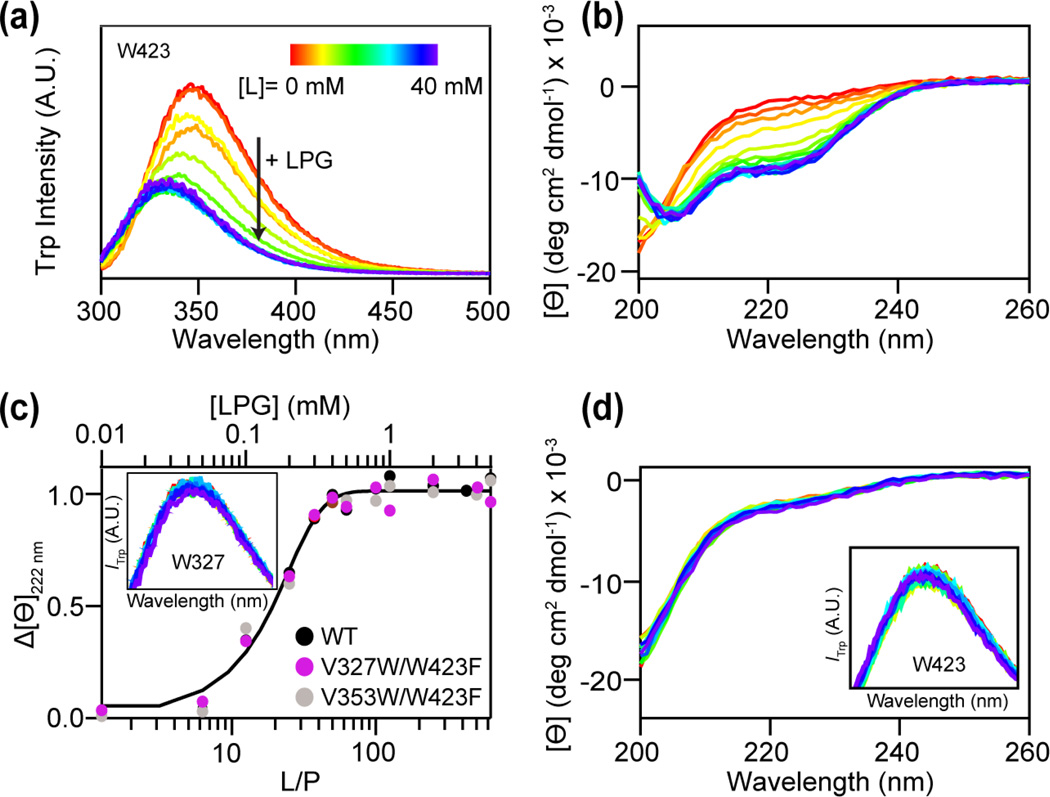
RPT interaction with lysolipids probed by W423 and CD spectroscopy. (a) W423 fluorescence in the presence of increasing LPG (0–40 mM). (b) Secondary structure changes of RPT with increasing concentrations of LPG measured by CD spectroscopy. (c) Representative plot of the mean residue ellipticity (Ɵ) at 222 nm versus lipid-to-protein ratio (L/P, bottom x-axis) and LPG concentration (top x-axis) for WT (black), V327W/W423F (magenta), and V353W/W423F (light grey). A sigmoid curve is shown as a guide. Inset: Fluorescence spectra of V327W/W423F in the presence of increasing LPG (0–40 mM). (d) CD spectra of WT RPT in the presence of increasing LPC (0–40 mM). Inset: W423 fluorescence in the presence of LPC. All measurements were performed with RPT monomers at 25 °C.

