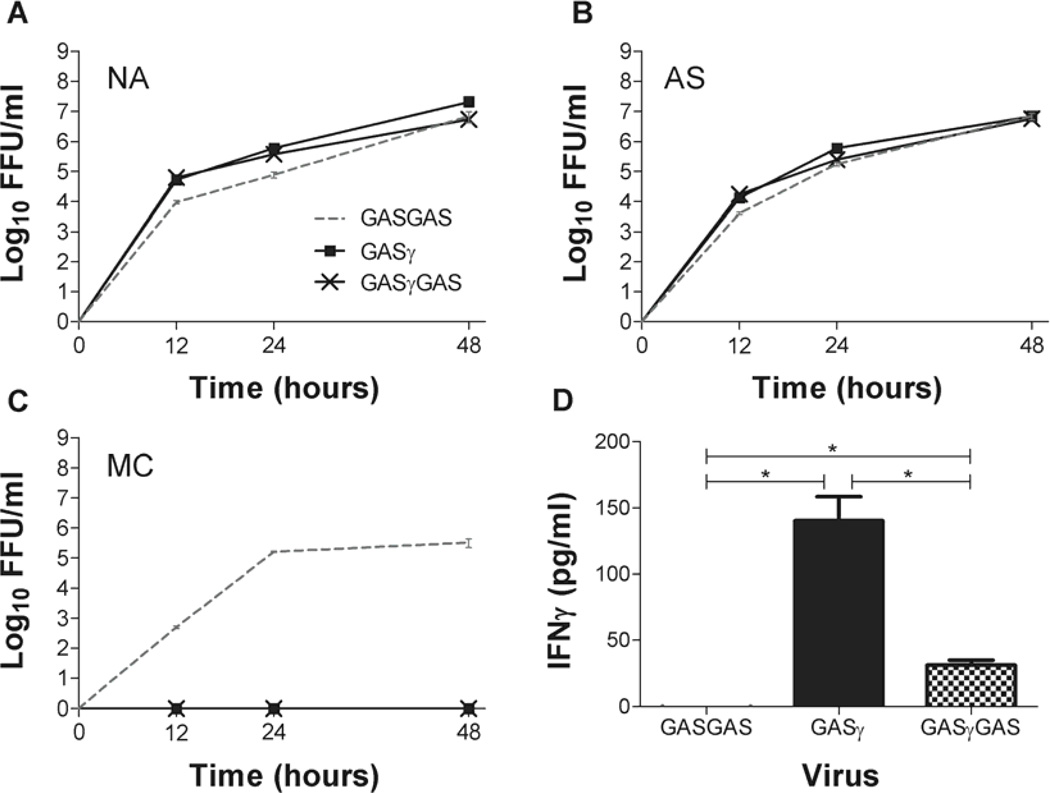
Fig. 2. In vitro growth of GAS variants.
NA, AS and MC cell lines were infected with GASGAS, GASγ or GASγGAS at an MOI=1 (A–C). Supernatant virus titers were measured at the indicated times post-infection. D shows IFNγ present in the supernatants of BSR cells 72 hours p.i. Significant difference was determined by the student’s t-test. *, p≤0.05.

