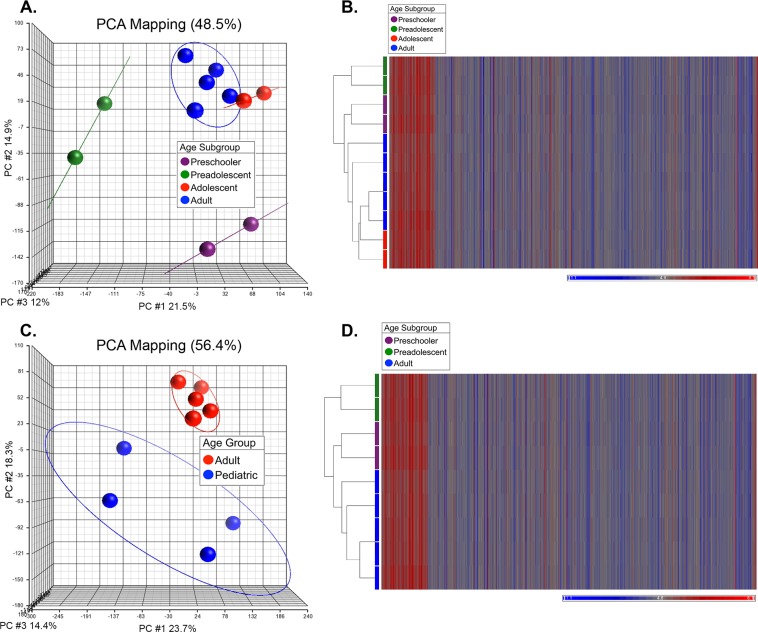
Figure 1.
Principal component analysis and hierarchical clustering of ex vivo HCEnC gene expression data sets. (A) PCA demonstrated three distinct groupings, with the adolescent (17 and 18 years, red spheres) HCEnC group having a closer relationship to adult samples (53–70 years, blue spheres) compared to preadolescents (10 and 11 years, green spheres) and preschoolers (4 and 6 years, violet spheres). (B) Hierarchical clustering confirmed the relationships observed with PCA, with the adolescent HCEnC samples (red bars) demonstrating a closer relationship to adult HCEnC samples (blue bars). (C) After removal of the HCEnC samples from the adolescent group, PCA demonstrated three distinct groupings, two of which were analyzed together as the pediatric group (preschooler and preadolescent, 4–11 years, blue spheres) and the adult group (53–57 years, red spheres). Subsequent data analysis was performed on two groups defined by the colored ovals (pediatric and adult). (D) Hierarchical clustering confirmed the relationships observed in the PCA analysis, with the preschooler (violet bar) and the preadolescent (green bar) HCEnC samples having clustered separately from the adult (blue bar) HCEnC.

