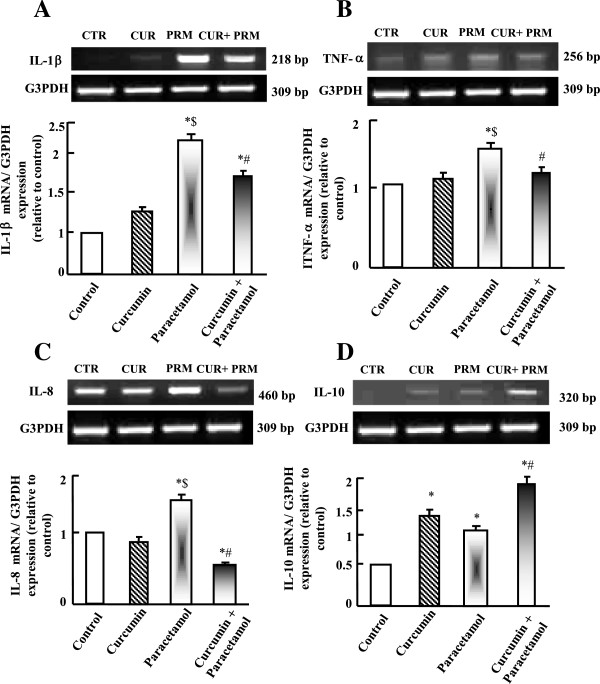
Figure 4.

Semi-quantitative RT-PCR analysis of IL-1β (A), TNF-α (B), IL-8 (C) and IL-10 (D) mRNA expressions and their corresponding G3PDH in liver. Experimental groups were administered corn oil as a control (CTR), curcumin (CUR), paracetamol (PRM), or curcumin plus paracetamol (CUR+PRM) as described in materials and methods. Values are means ± SEM obtained from 3 independent experiments. P*< 0.05 vs. control group, P$< 0.05 vs. curcumin administered group and P#< 0.05 vs. paracetamol administered group.
