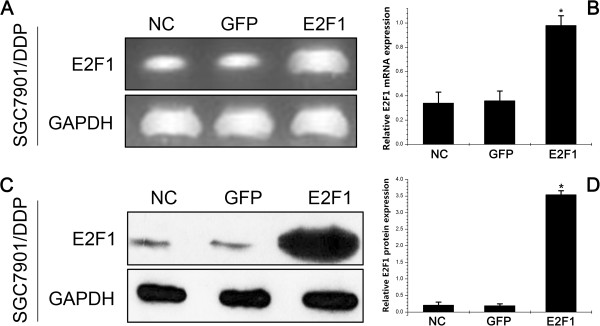
Figure 1.

E2F1 mRNA and protein expressions after gene transfection in SGC7901/DDP cells. A: Expression level of E2F1 mRNA was determined by semiquantitative reverse-transcriptase polymerase chain reaction; B: mRNA results are expressed as the ratio of E2F1 to glyceraldehyde 3-phosphate dehydrogenase (GAPDH); C: Expression level of E2F1 protein was determined by western blotting; D: Western blotting results are expressed as the ratio of optical density of E2F1 bands to GAPDH bands. All values are mean ± SE. * P < 0.05 for E2F1 group versus GFP group and negative control (NC) group.
