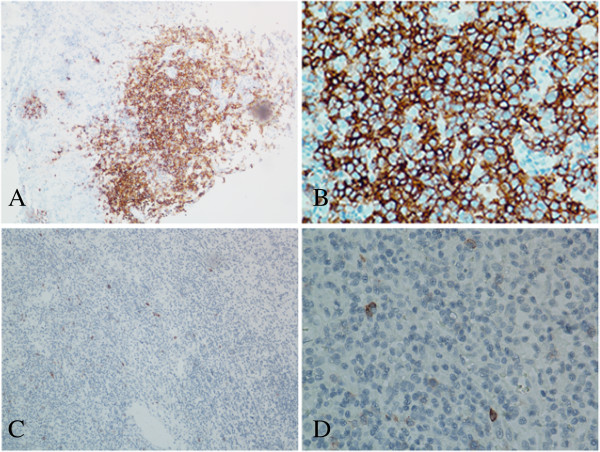
Figure 1.

Immunohistochemical analysis of CD30 expression in extranodal natural killer T-cell lymphomas, nasal type (ENKTL). A and B, representative images of CD30-positive tumor cells showing strong cell membrane staining (brown) (magnification in A × 100, B × 400); C and D, representative image of CD30-negative tumor cells showing no membrane staining (magnification in C × 100, D × 400).
