Figure 3.

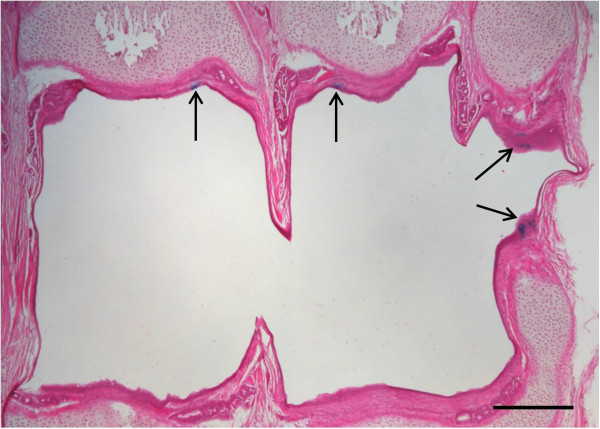
Tracheal histology. Light eosin-stained tracheal cross section of trachea shows patchy LacZ transduction. Scale bar 100 μm. Arrows mark LacZ transduced tracheal cells.

Tracheal histology. Light eosin-stained tracheal cross section of trachea shows patchy LacZ transduction. Scale bar 100 μm. Arrows mark LacZ transduced tracheal cells.