Figure 1.
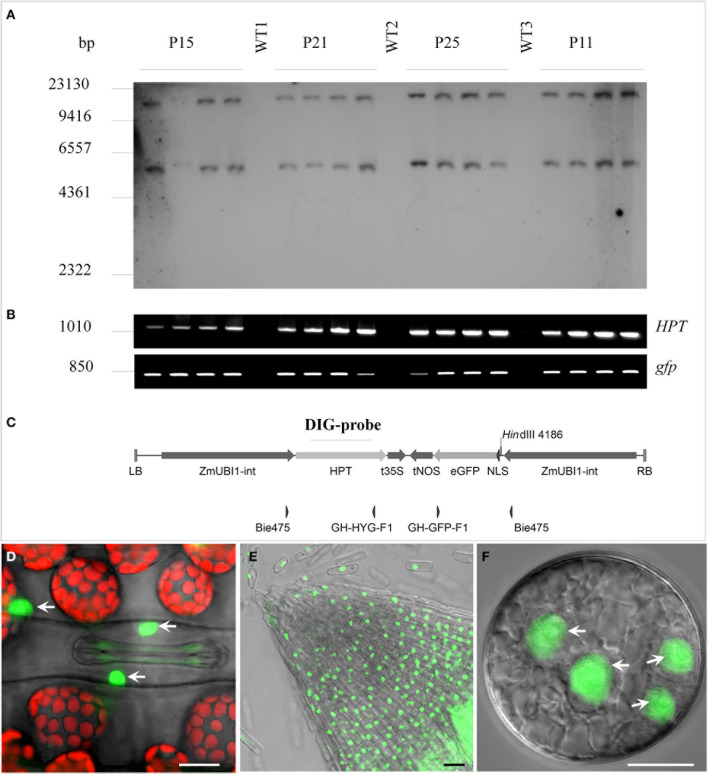
Characterization of the doubled haploid SV40-NLS:GFP transgenic barley line displaying nucleus-specific accumulation of GFP. Randomly chosen T2-siblings (four per family) derived from four T1-plants (P11, P15, P21, P25) were analyzed for genomic T-DNA integration and transgene zygosity. (A) DNA gel blot analysis of HindIII-digested genomic DNA hybridized with an HPT-specific probe. The two bands seen per lane indicate genomic integration of two T-DNA copies. (B) PCR analysis with primer pairs specific for the HPT (upper band) and the GFP (lower band) genes. (C) Map of T-DNA with primer pairs and hybridization probe positions indicated. WT1, 2 and 3, wild type individuals of cv. “Igri”; LB, left border; ZmUBI1-int, maize UBIQUITIN1 promoter with first intron; HPT, hygromycin B phosphotransferase protein coding region; t35S, CaMV 35S gene terminator; tNOS, NOPALINE SYNTHASE gene terminator; eGFP, synthetic S65T green fluorescent protein coding region; NLS, SV40 Simian virus 40 nuclear localization signal; RB, right border. (D) Leaf tissue with GFP in the nuclei of guard and other epidermis cells. Chlorophyll autofluorescence shown in red. (E) GFP accumulation in the nuclei of a root tip. (F) GFP accumulation in nuclei of immature pollen after the second embryogenic pollen mitosis. Bar = 30 μm.

