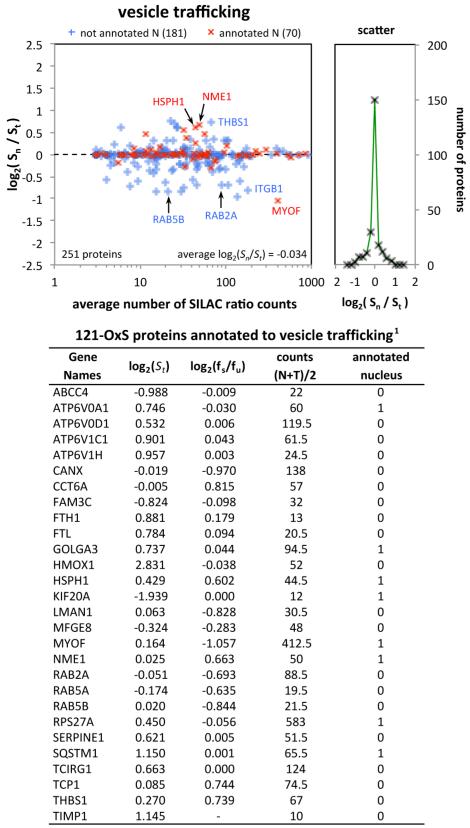
Figure 8.
Analysis of proteins annotated to vesicular trafficking. Left: log2(Sn/St) = log2(fs/fu) as a function of the average number of ratio counts over the nucleus and total data sets for proteins annotated to “vesicle-mediated transport” or to “cytoplasmic vesicle”. Proteins with (red, 70 proteins) or without (blue, 181 proteins) annotation to nucleus are indicated. Right: number of proteins versus log2(fs/fu). Table: Data for 28 proteins of the 121-OxS set.

