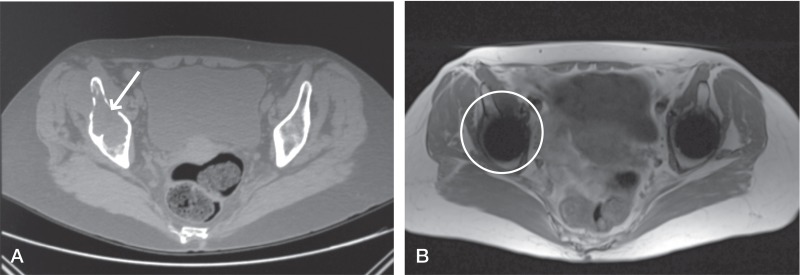
Figure 4.
Comparison of the CT image (A) and the MARS MRI image (B) used to evaluate osteolysis in the same patient illustrates the comparative difficulties in identifying acetabular anatomy on MRI images, which are clear on the corresponding CT image. There is an absence of signal on MRI in this region. Coupled with the inferior bony distinction on MRI, this has prevented the identification of osteolytic changes—which are clear on CT (see arrow).

