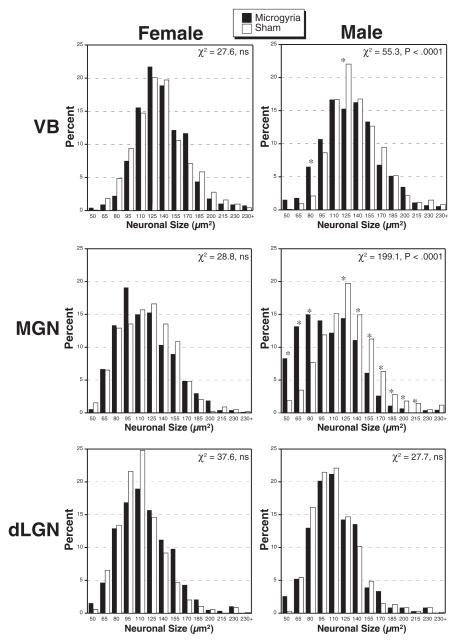
Fig. 5.
Frequency histograms of neuronal size in lesioned (black) and sham (white) male and female subjects. In VB and MGN there is a significant difference in distribution of cell sizes in males, with there being more small and fewer large neurons in subjects with microgyria. There are no significant differences in cell size distribution in the dLGN. Asterisks indicate bins with significant contributions to the chi-square.

