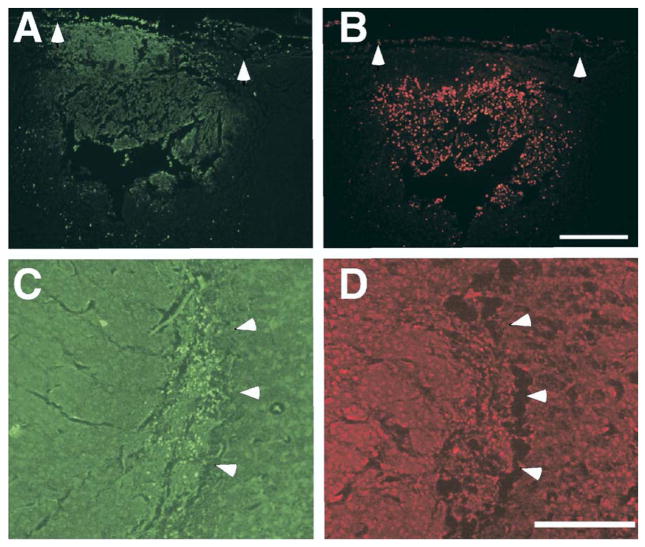
Fig. 7.
Fluorescence photomicrographs of FJB-positive and TUNEL-positive profiles. (A) FJB-stained profiles in a lesioned area of the neocortex (arrowheads define medial and lateral border). (B) Section adjacent to panel A stained for TUNEL (arrowheads define medial and lateral border). (C) FJB positive profiles in the VB nucleus of the thalamus (arrowheads define lateral border). (D) Section adjacent to panel C stained for TUNEL (arrowheads aligned with panel C). Scale bar=250 μm.

