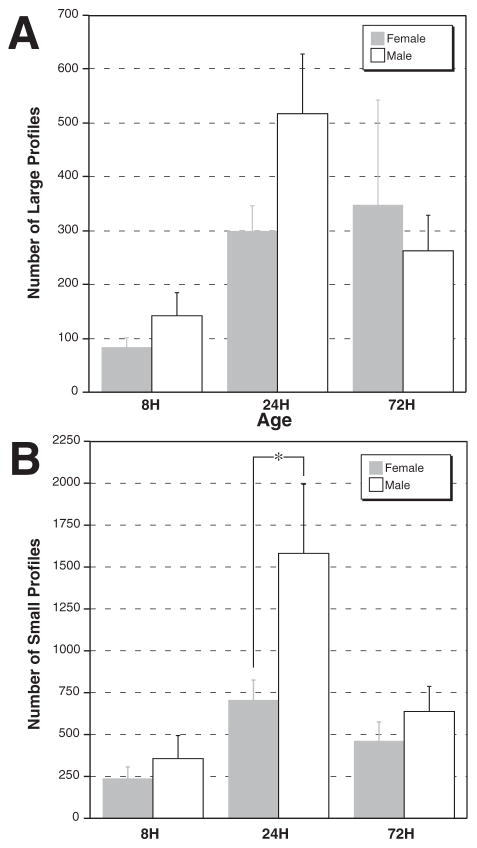
Fig. 9.
Mean (±S.E.M.) number of large and small profiles in VB of female (dark bars) and male (white bars) subjects with microgyria. (A) There were no significant differences in large profiles. (B) There are significant main effects of Sex and Age in the number of small profiles, with an increased number of profiles in the 24 h group. There is a sex difference at this age with females having fewer profiles than males.

