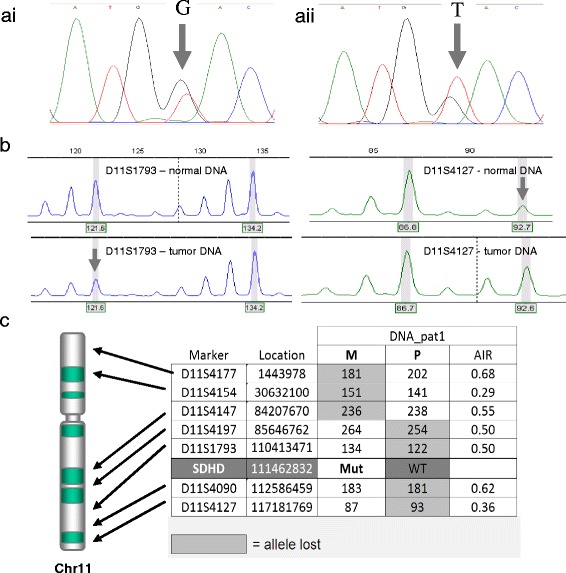
Figure 2.

Patient 1 – tumor analysis. a) Sanger sequencing of SDHD in normal (ai) and tumor (aii) DNA. Arrows indicate the relevant nucleotides in the heterozygous patient. b) Typical profiles of microsatellite marker alleles showing loss of heterozygosity. Arrows indicate the allele lost. c) Table indicating loss of microsatellite marker alleles and parental origin, with approximate positions indicated on an ideogram of chromosome 11.
