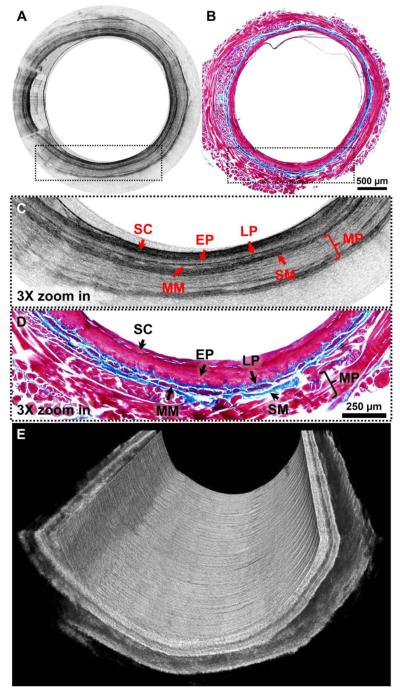
Fig. 3.
A, representative 2D circwnferential in vivo OCT im age of guinea pig esophagus and, B, its corresponding histology micrograph. C and D show 3 × zoomed-in regions of the dotted boxes inA and B, respectively. E is a cutaway view of a 3D OCT image of guinea pig esophagus. SC, stratum comeum; EP, epithelium; LP, lamina propria; MM, muscularis mucosae; SM, submucosa; MP, muscularis propria. Scale bars: 500 μm in A and B; 250 μm in Cand D.

