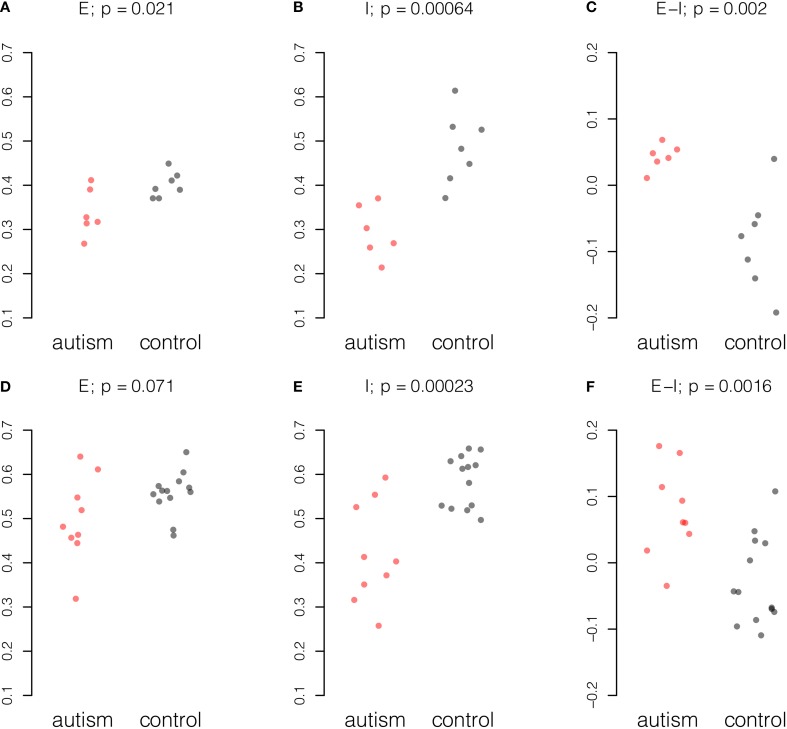
Figure 1.
Summary of excitatory and inhibitory changes in cortical samples from mature individuals. Expression for each probe scaled to the range [0, 1] and averaged across probes and individuals. Upper panel, six autism and seven control samples in the Chow dataset: (A) Excitatory expression, (B) Inhibitory expression, and (C) Excitatory-inhibitory difference. Lower panel, nine autism and 13 control samples in the Voineagu dataset. (D) Excitatory expression, (E) Inhibitory expression, and (F) Excitatory-inhibitory difference. P-values were computed by Student t-test.

