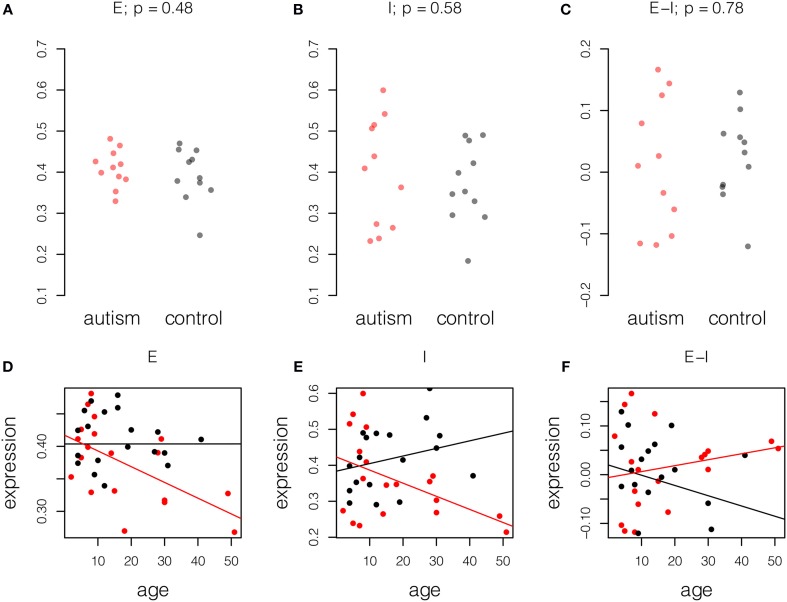
Figure 2.
Age-related changes in excitation and inhibition in autism. Expression for each probe scaled to the range [0, 1] and averaged across probes and individuals. Upper panel, samples of age less than 15 years, 11 autism and 11 control. P-values computed by Student t-test. (A) Excitatory expression, (B) Inhibitory expression, and (C) Excitatory-inhibitory difference. Lower panel, fitted models of excitatory and inhibitory molecule expression with age in years in autism cases (red) and controls (black). Model parameters are given ± standard error. (D) Excitatory expression does not change with age in controls (fitted model equation: 0.40[±0.02] + 0.0[±7.4]*10−4 * age). However, relative reduction in excitatory expression with age is significant in autistic samples (fitted model equation: 0.014[±0.026] – 0.0024[±0.0011] * age). (E) Inhibitory expression does not change significantly with age in controls (fitted model equation: 0.38[±0.04] + 0.0021[±0.0015] * age). However, relative reduction in inhibitory expression with age is significant in autistic samples (fitted model equation: 0.039[±0.054] – 0.0057[±0.0023] * age). (F) Difference between excitation and inhibition does not decrease significantly with age in controls (fitted model equation: 0.020[±0.031] – 0.0021[±0.0012] * age). Relative to controls, increase in E-I difference is also not significant (fitted model equation: −0.026[±0.044] + 0.0033[±0.0019] * age). Thus, decreases in excitation and inhibition largely cancel in this small dataset.

