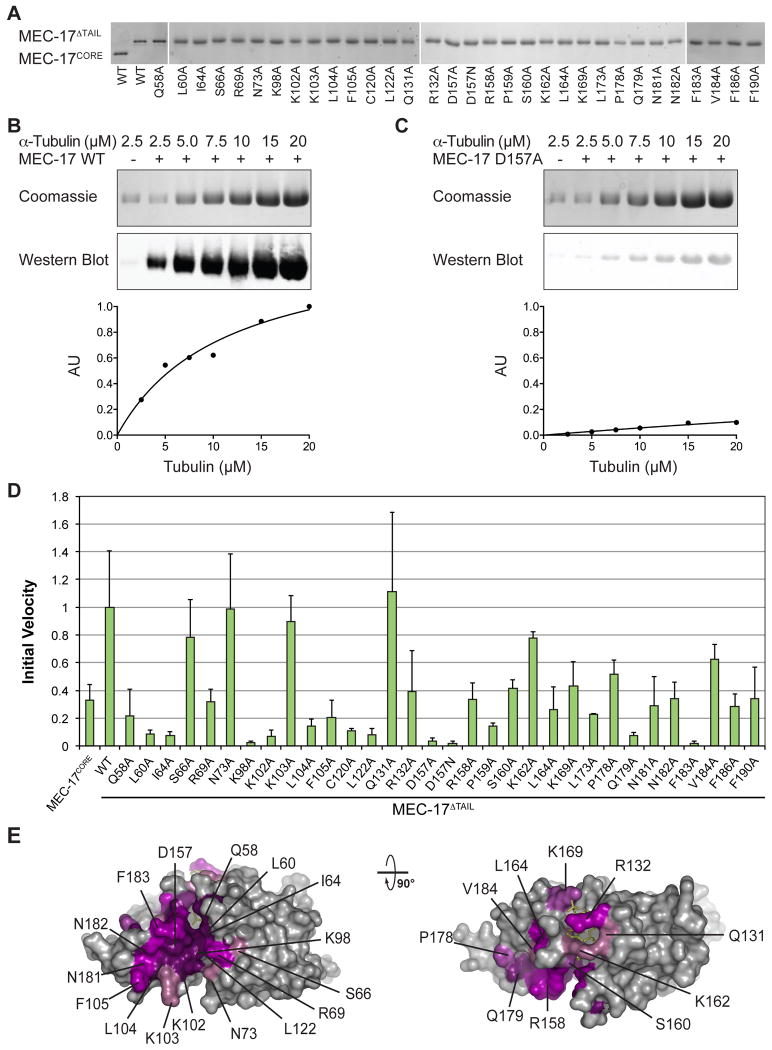
Fig. 4. Mutational Analysis.
(a) WT and mutant forms of MEC-17 used in in vitro biochemical assays visualized on SDS-PAGE gels. (b) Representative biochemical data for wildtype MEC-17. Reaction volumes separated by SDS-PAGE stained with Coomassie brilliant blue, or immunoblotted with an acetylated K40 α-tubulin specific antibody (top). Quantification of immunoblots using an Odyssey Imaging System (bottom). (c) The same as in (b), for a catalytically dead mutant (D157A). (d) Normalized initial velocities of all tested MEC-17CORE mutants. Error bars represent standard error. All experiments were repeated at least 3 times. (e) Surface representation colored according to relative acetyltrasferase activity of alanine mutants in a gradient from light purple (>80 % activity) to dark purple (<20 % activity). A 90° rotated view is shown on the right.

