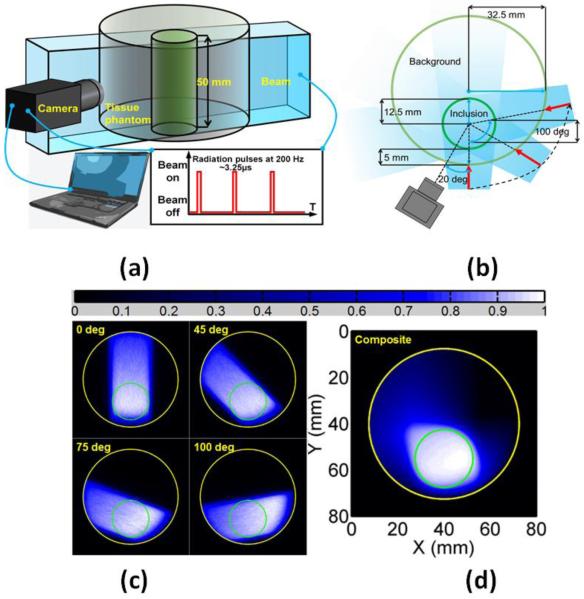
Figure 3.
Schematic diagram of imaging experiments. (a) Diagram of imaging system with camera and time gating. (b) Overhead schematic of phantom geometry and beam locations with respect to the camera. (c) Cherenkov radiation profile from Monte Carlo Simulations. (d) Composite map of summed Cherenkov radiation for all beam locations, which is known to be a surrogate of the radiation dose map (43-47).

