FIGURE 3.
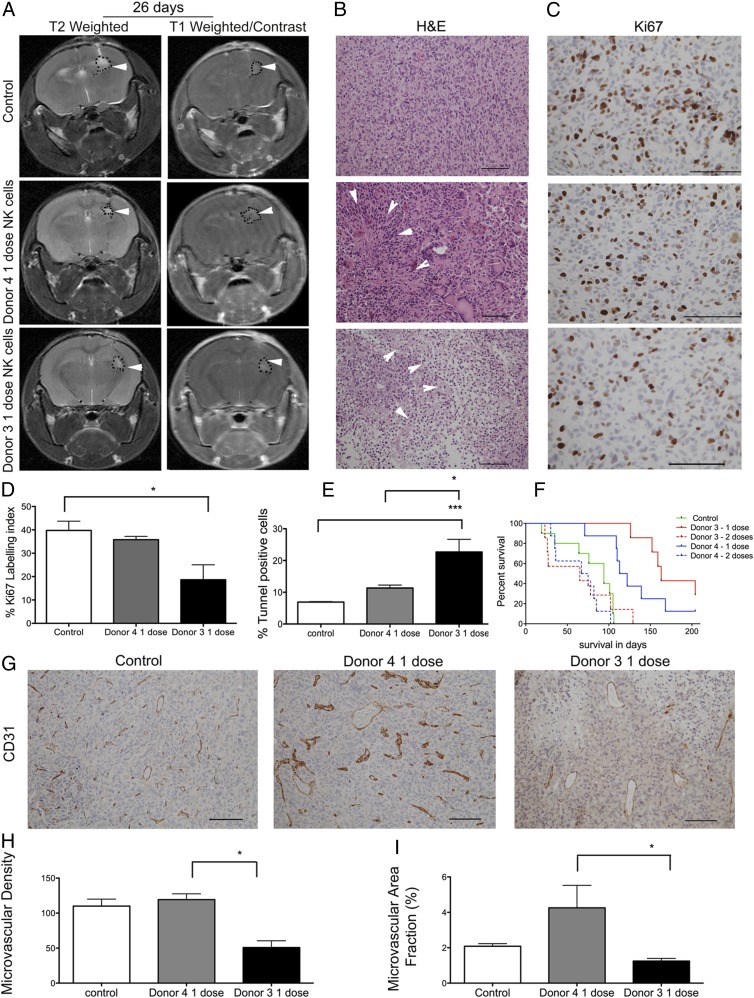
Treatment with a single dose of NK cells significantly increases animal survival. (A) T2-weighted and postcontrast T1-weighted images of NOD/SCID mice bearing P3 tumors treated with one dose of NK cells from donor 4 or donor 3 or controls. Tumors are indicated by arrowheads. (B) H&E staining of tumors treated with donor 3–derived or donor 4–derived NK cells. Necrosis is indicated by arrowheads (scale bar, 100 μm; original magnification ×200). (C) Ki-67+ cells (scale bar, 100 μm; original magnification ×400). Percentage Ki-67–positive (D) and cell death as represented by the percentage of TUNEL+ apoptotic/necrotic cells (E). Data are mean ± SEM. (F) Kaplan–Meier survival curves of animals treated with vehicle PBS/CD2 and NKp46 Abs (n = 10 animals) or with one or two doses of NK cells from donor 4 or donor 3 (n = 7 animals/group). (G) CD31 immunostaining from control mouse and mice that received one dose of NK cells from donor 4 or donor 3 (scale bar, 100 μm; original magnification ×200). Microvascular density (H) and percentage of area positive for CD31 microvessels (I). *p < 0.05, ***p < 0.001.

